Dockermetrics IDE
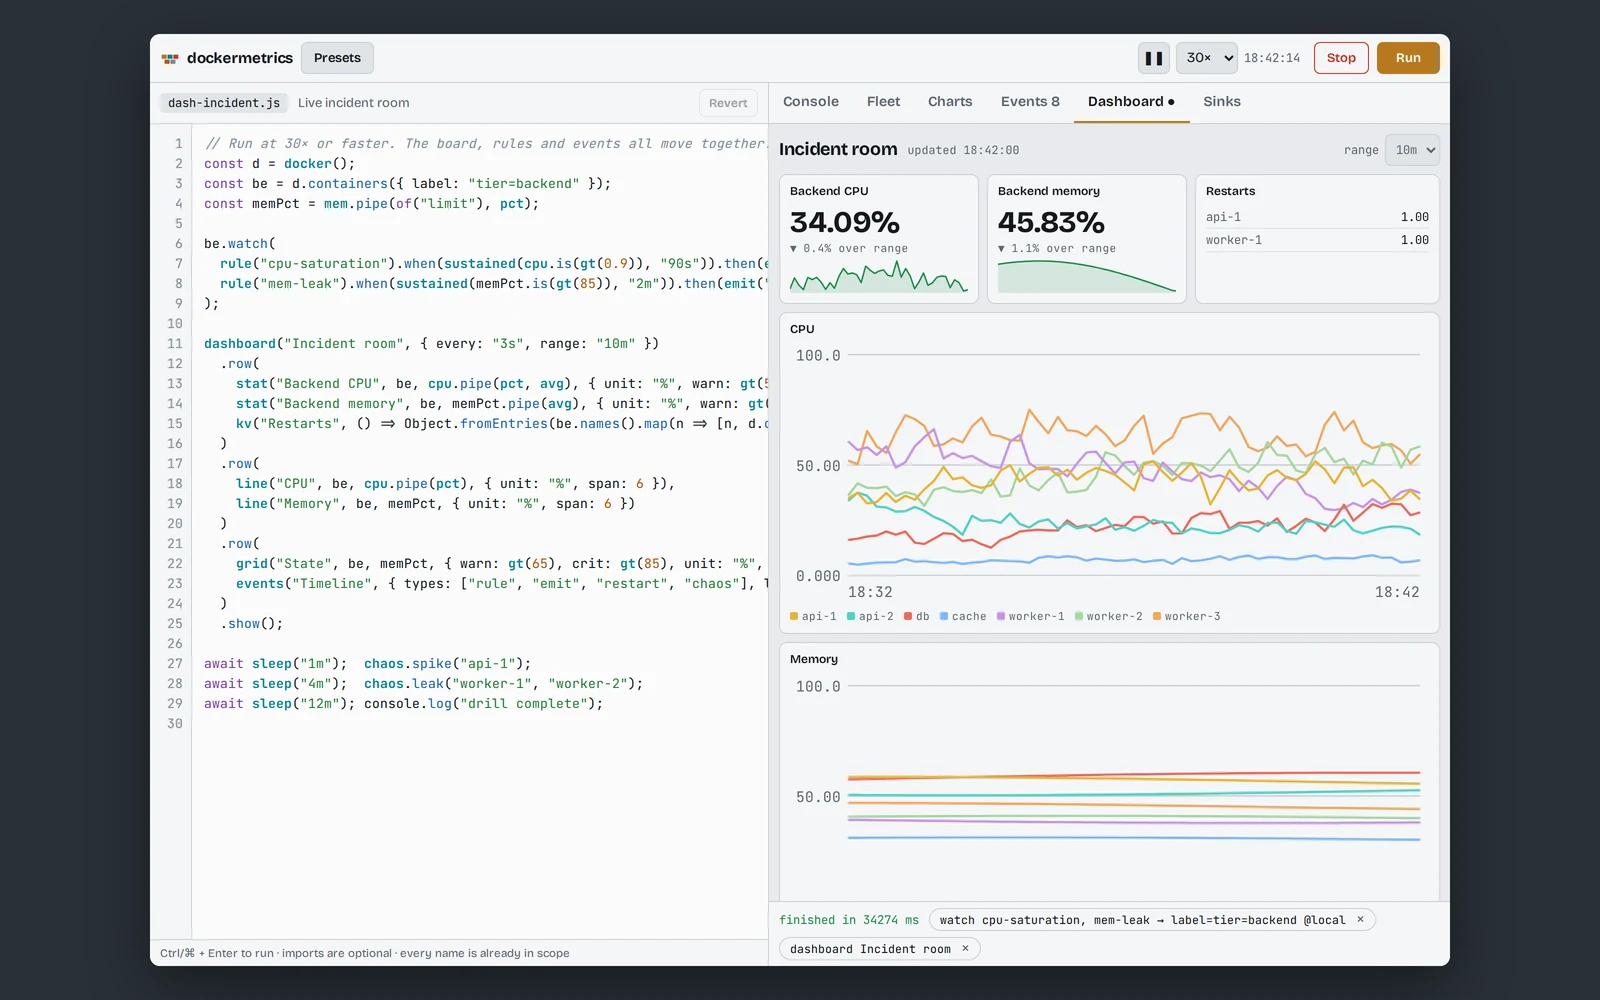
An IDE for a composable JavaScript grammar over Docker metrics: query, stream, alert and build dashboards against a simulated container fleet that runs in the browser.
In early access for subscribers until 22 November 2026. Subscribe to run it now.
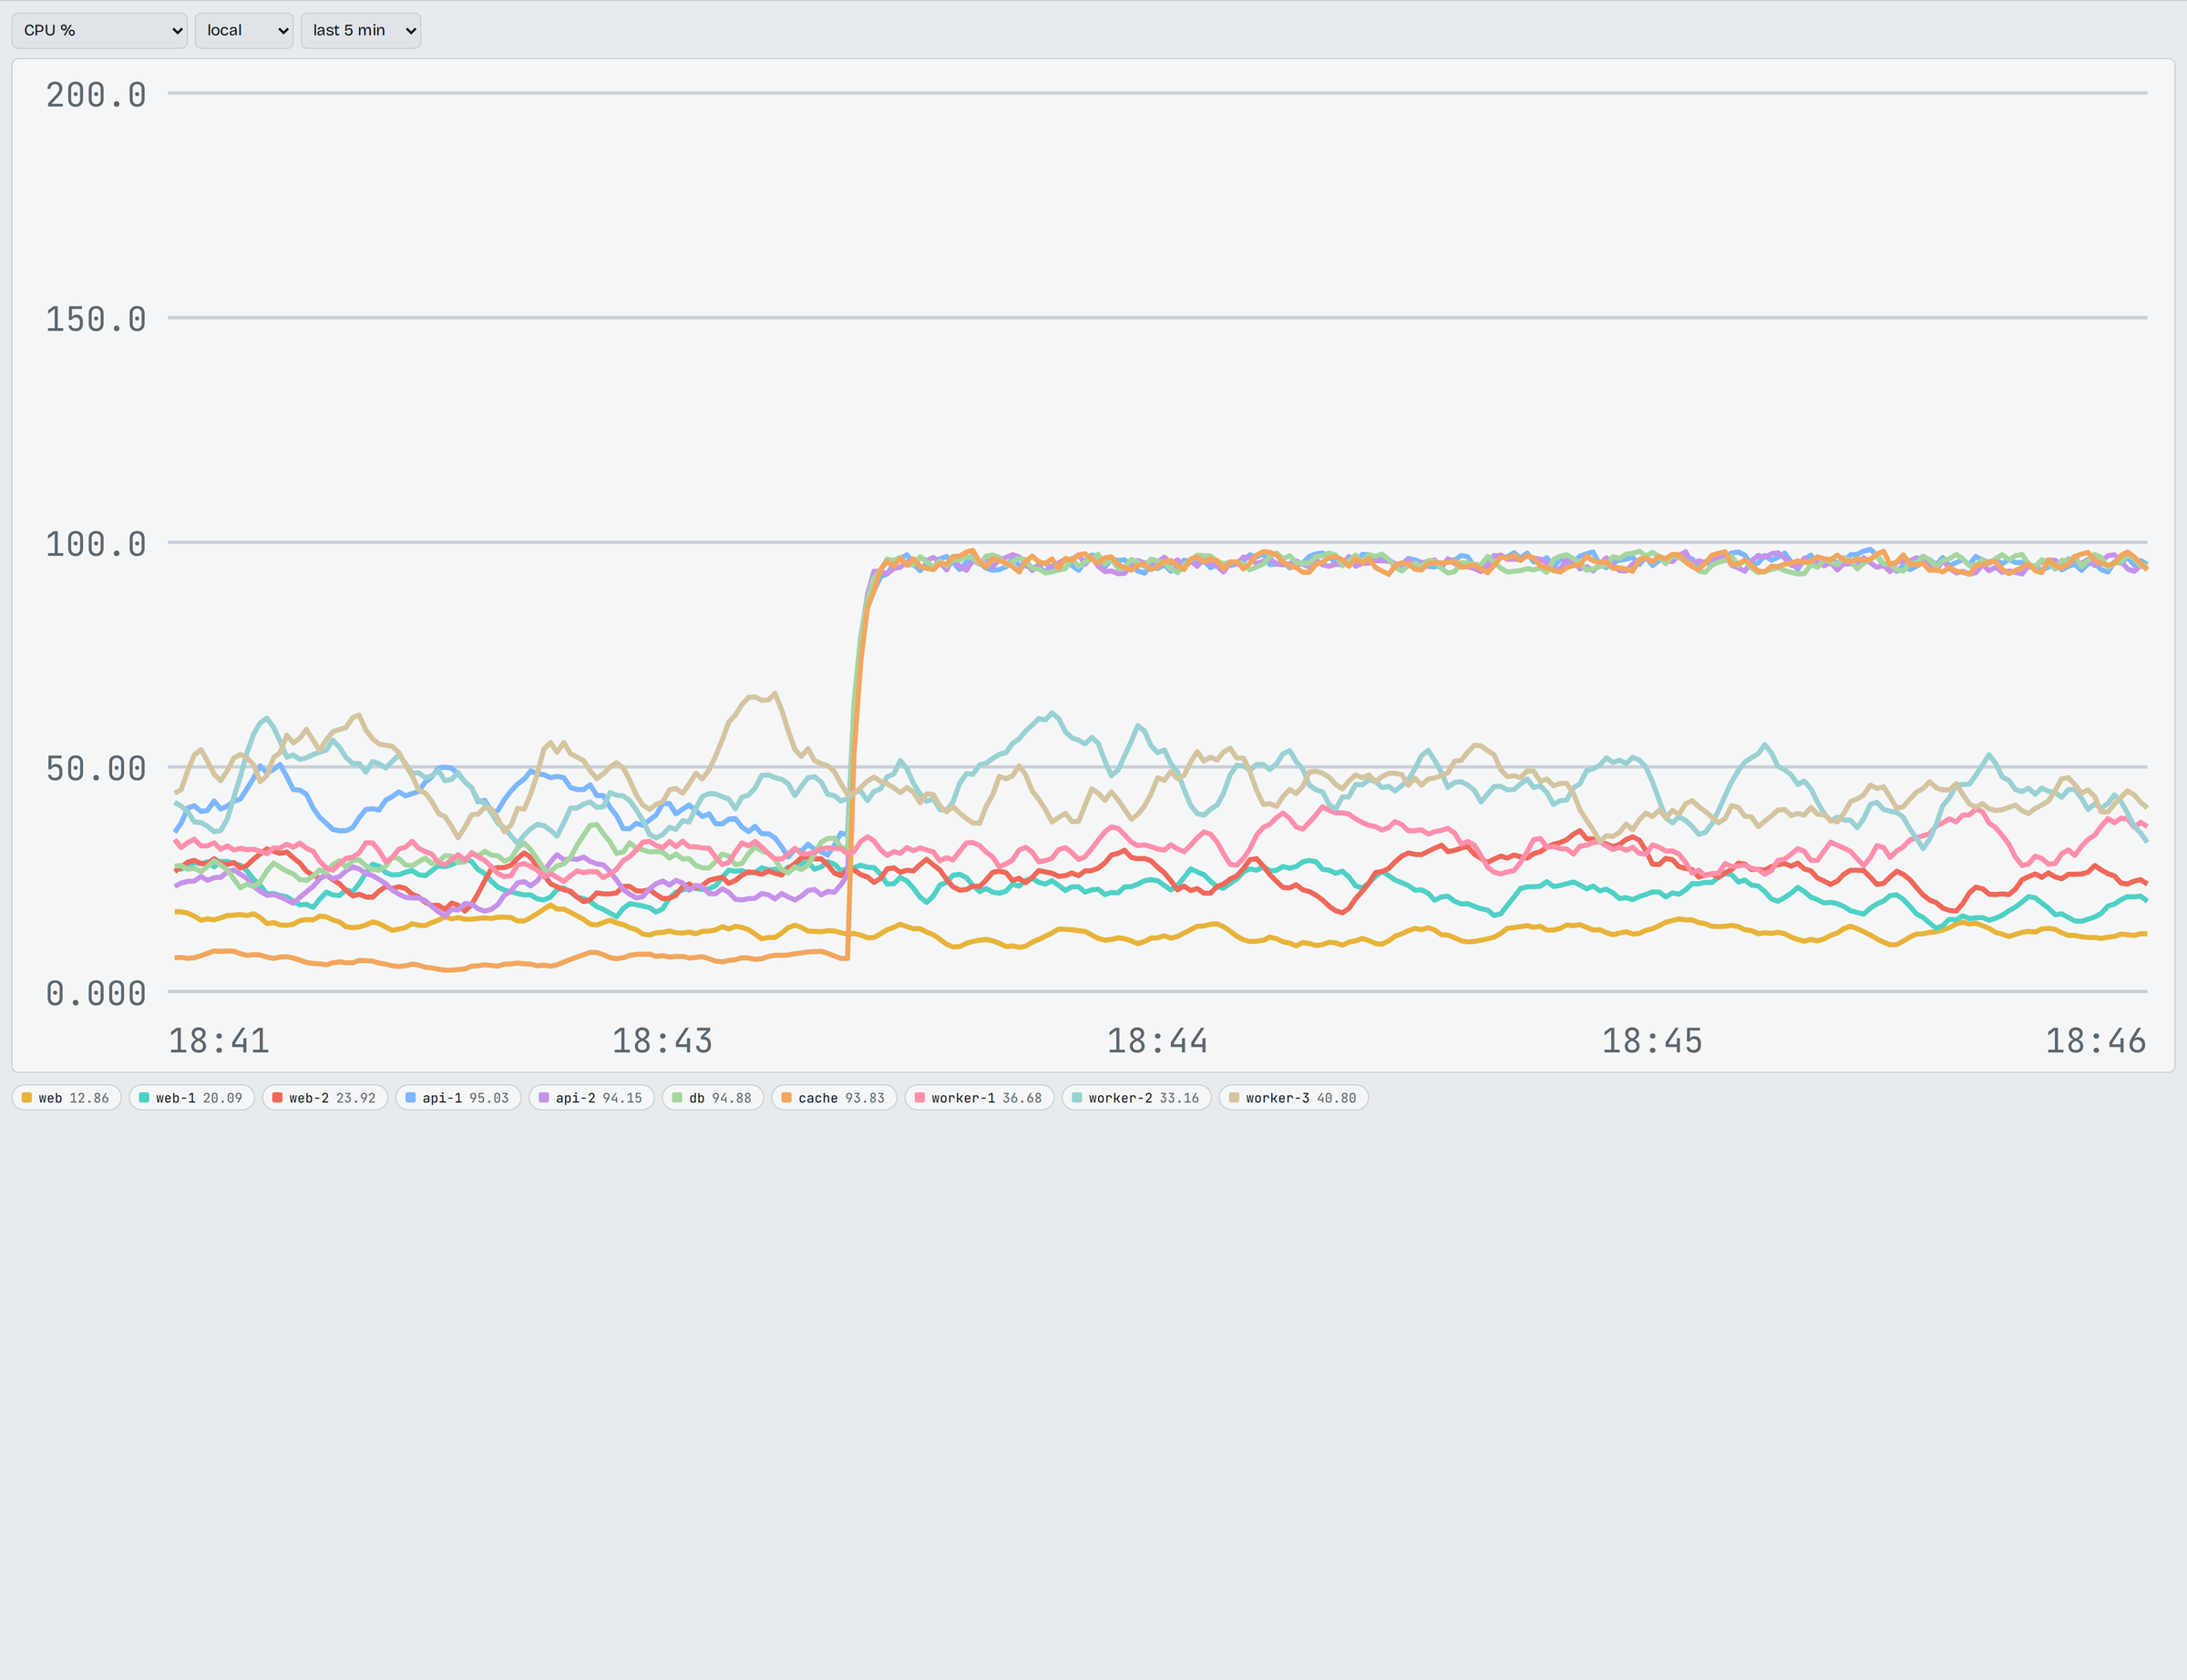
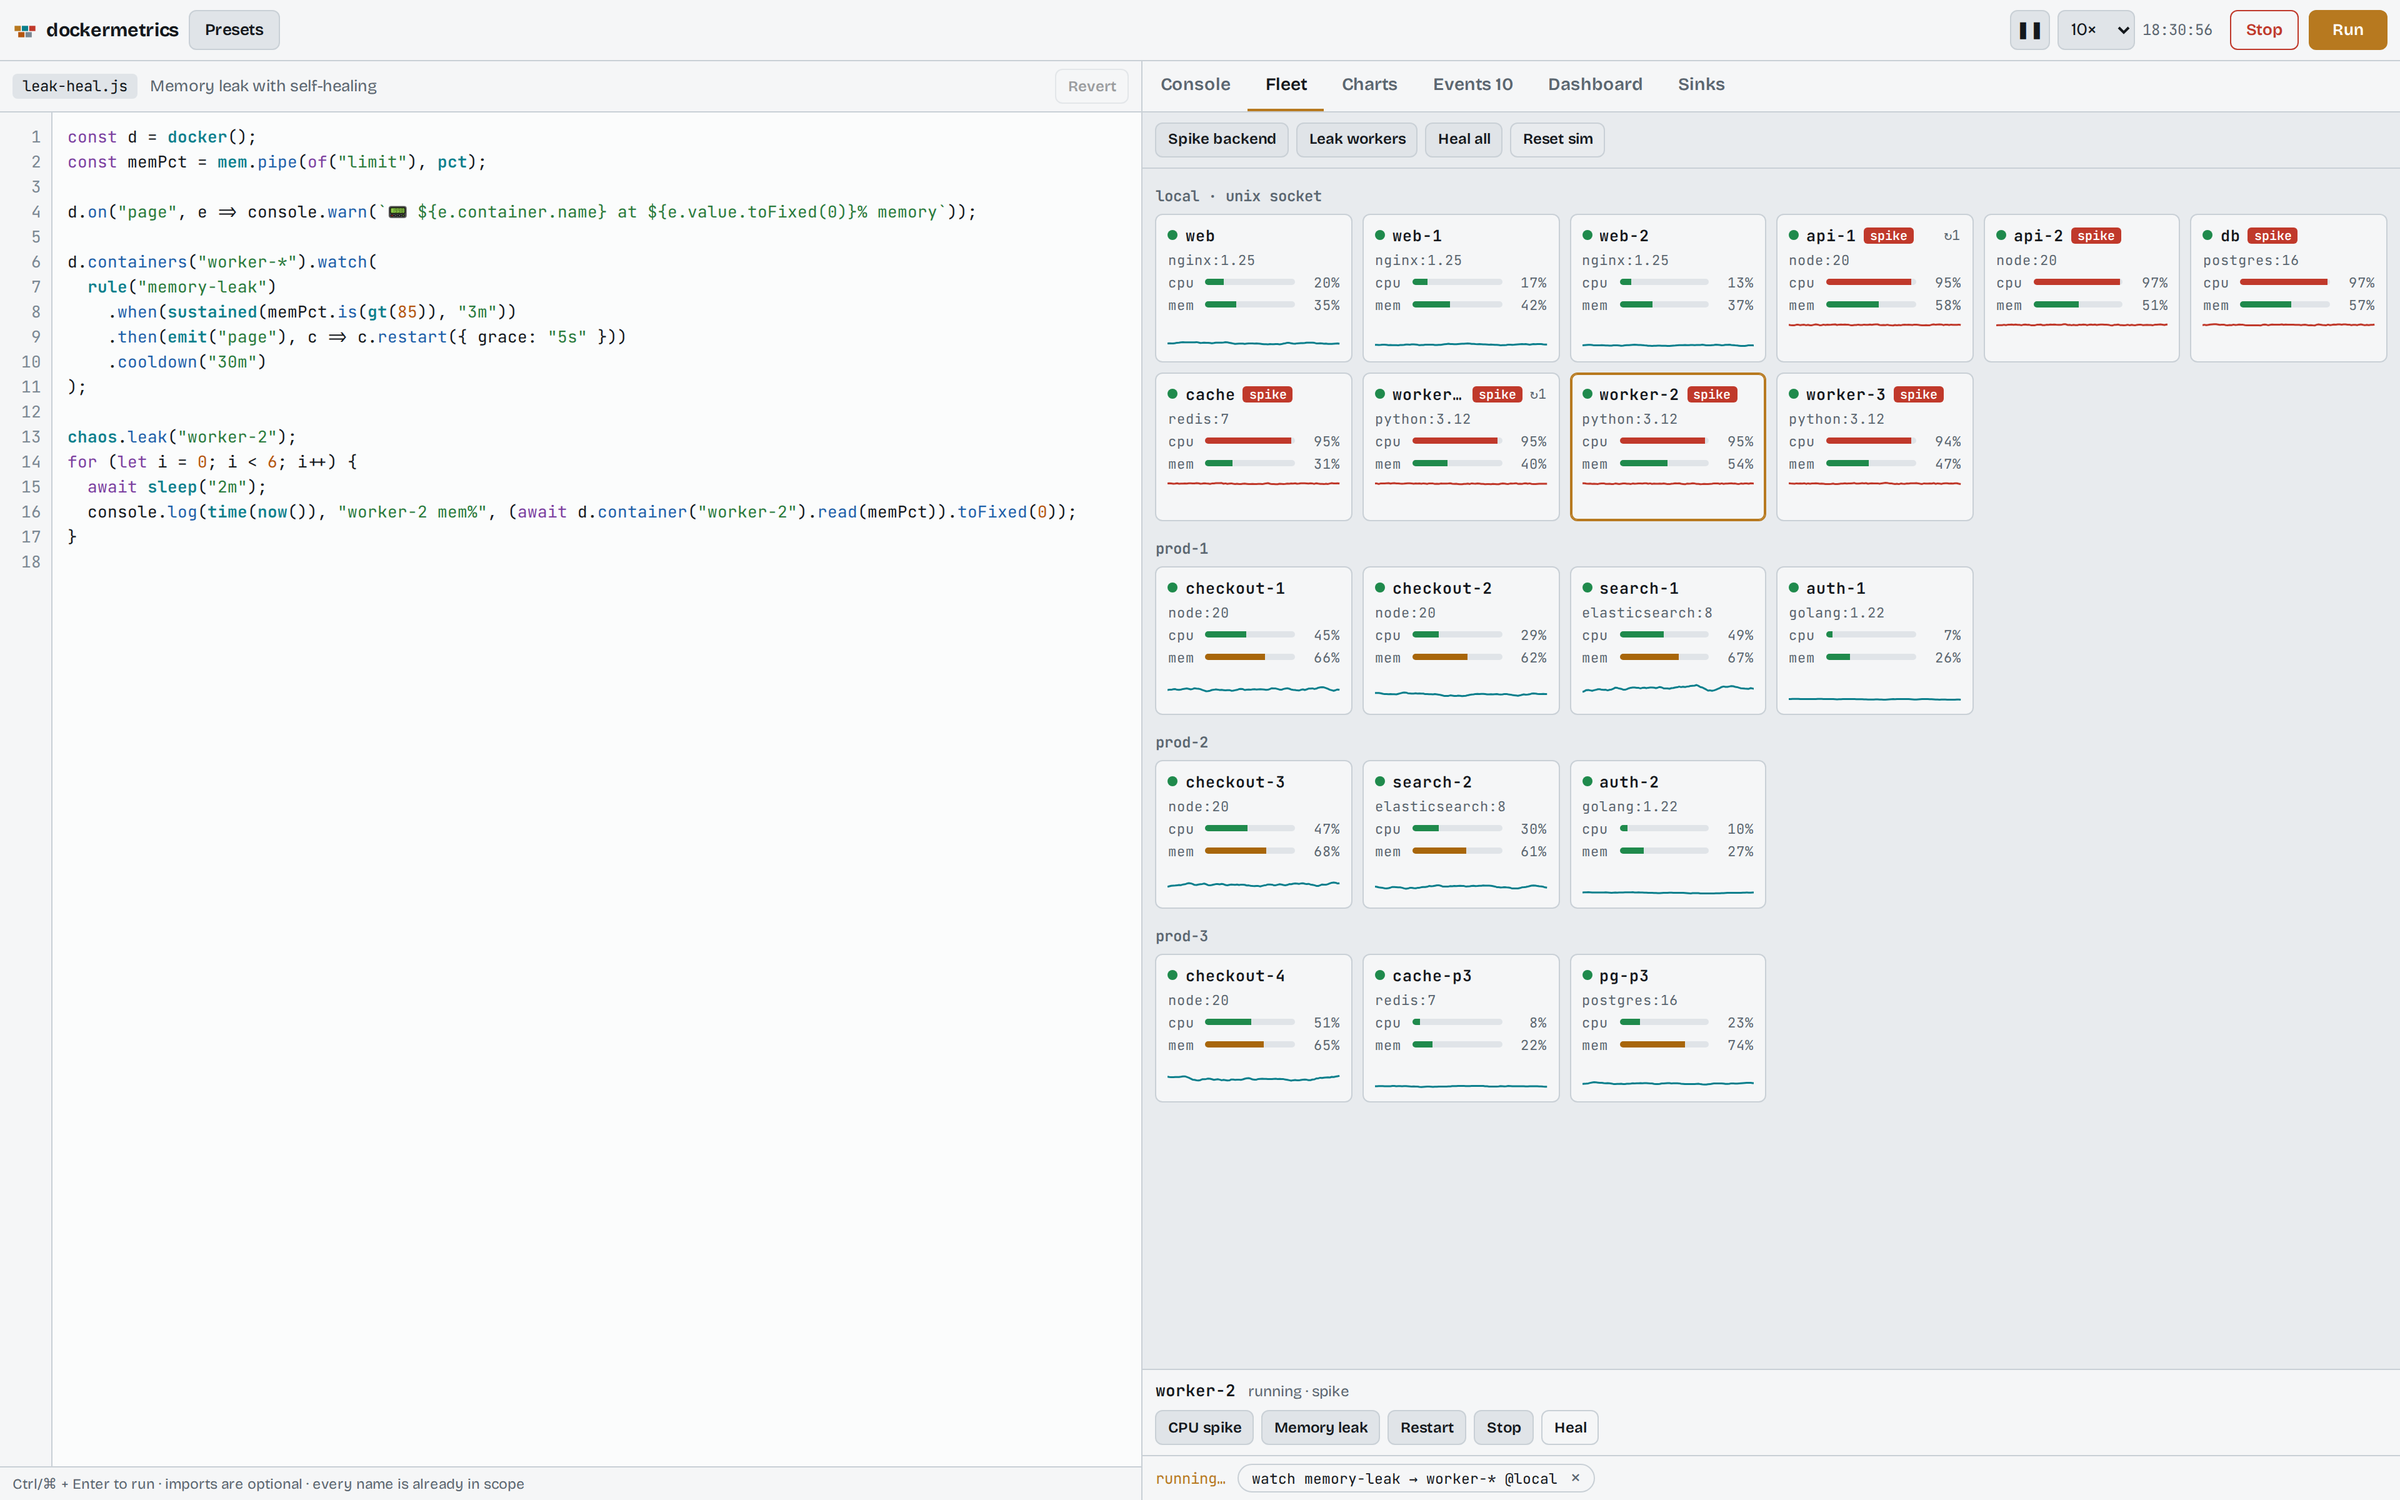
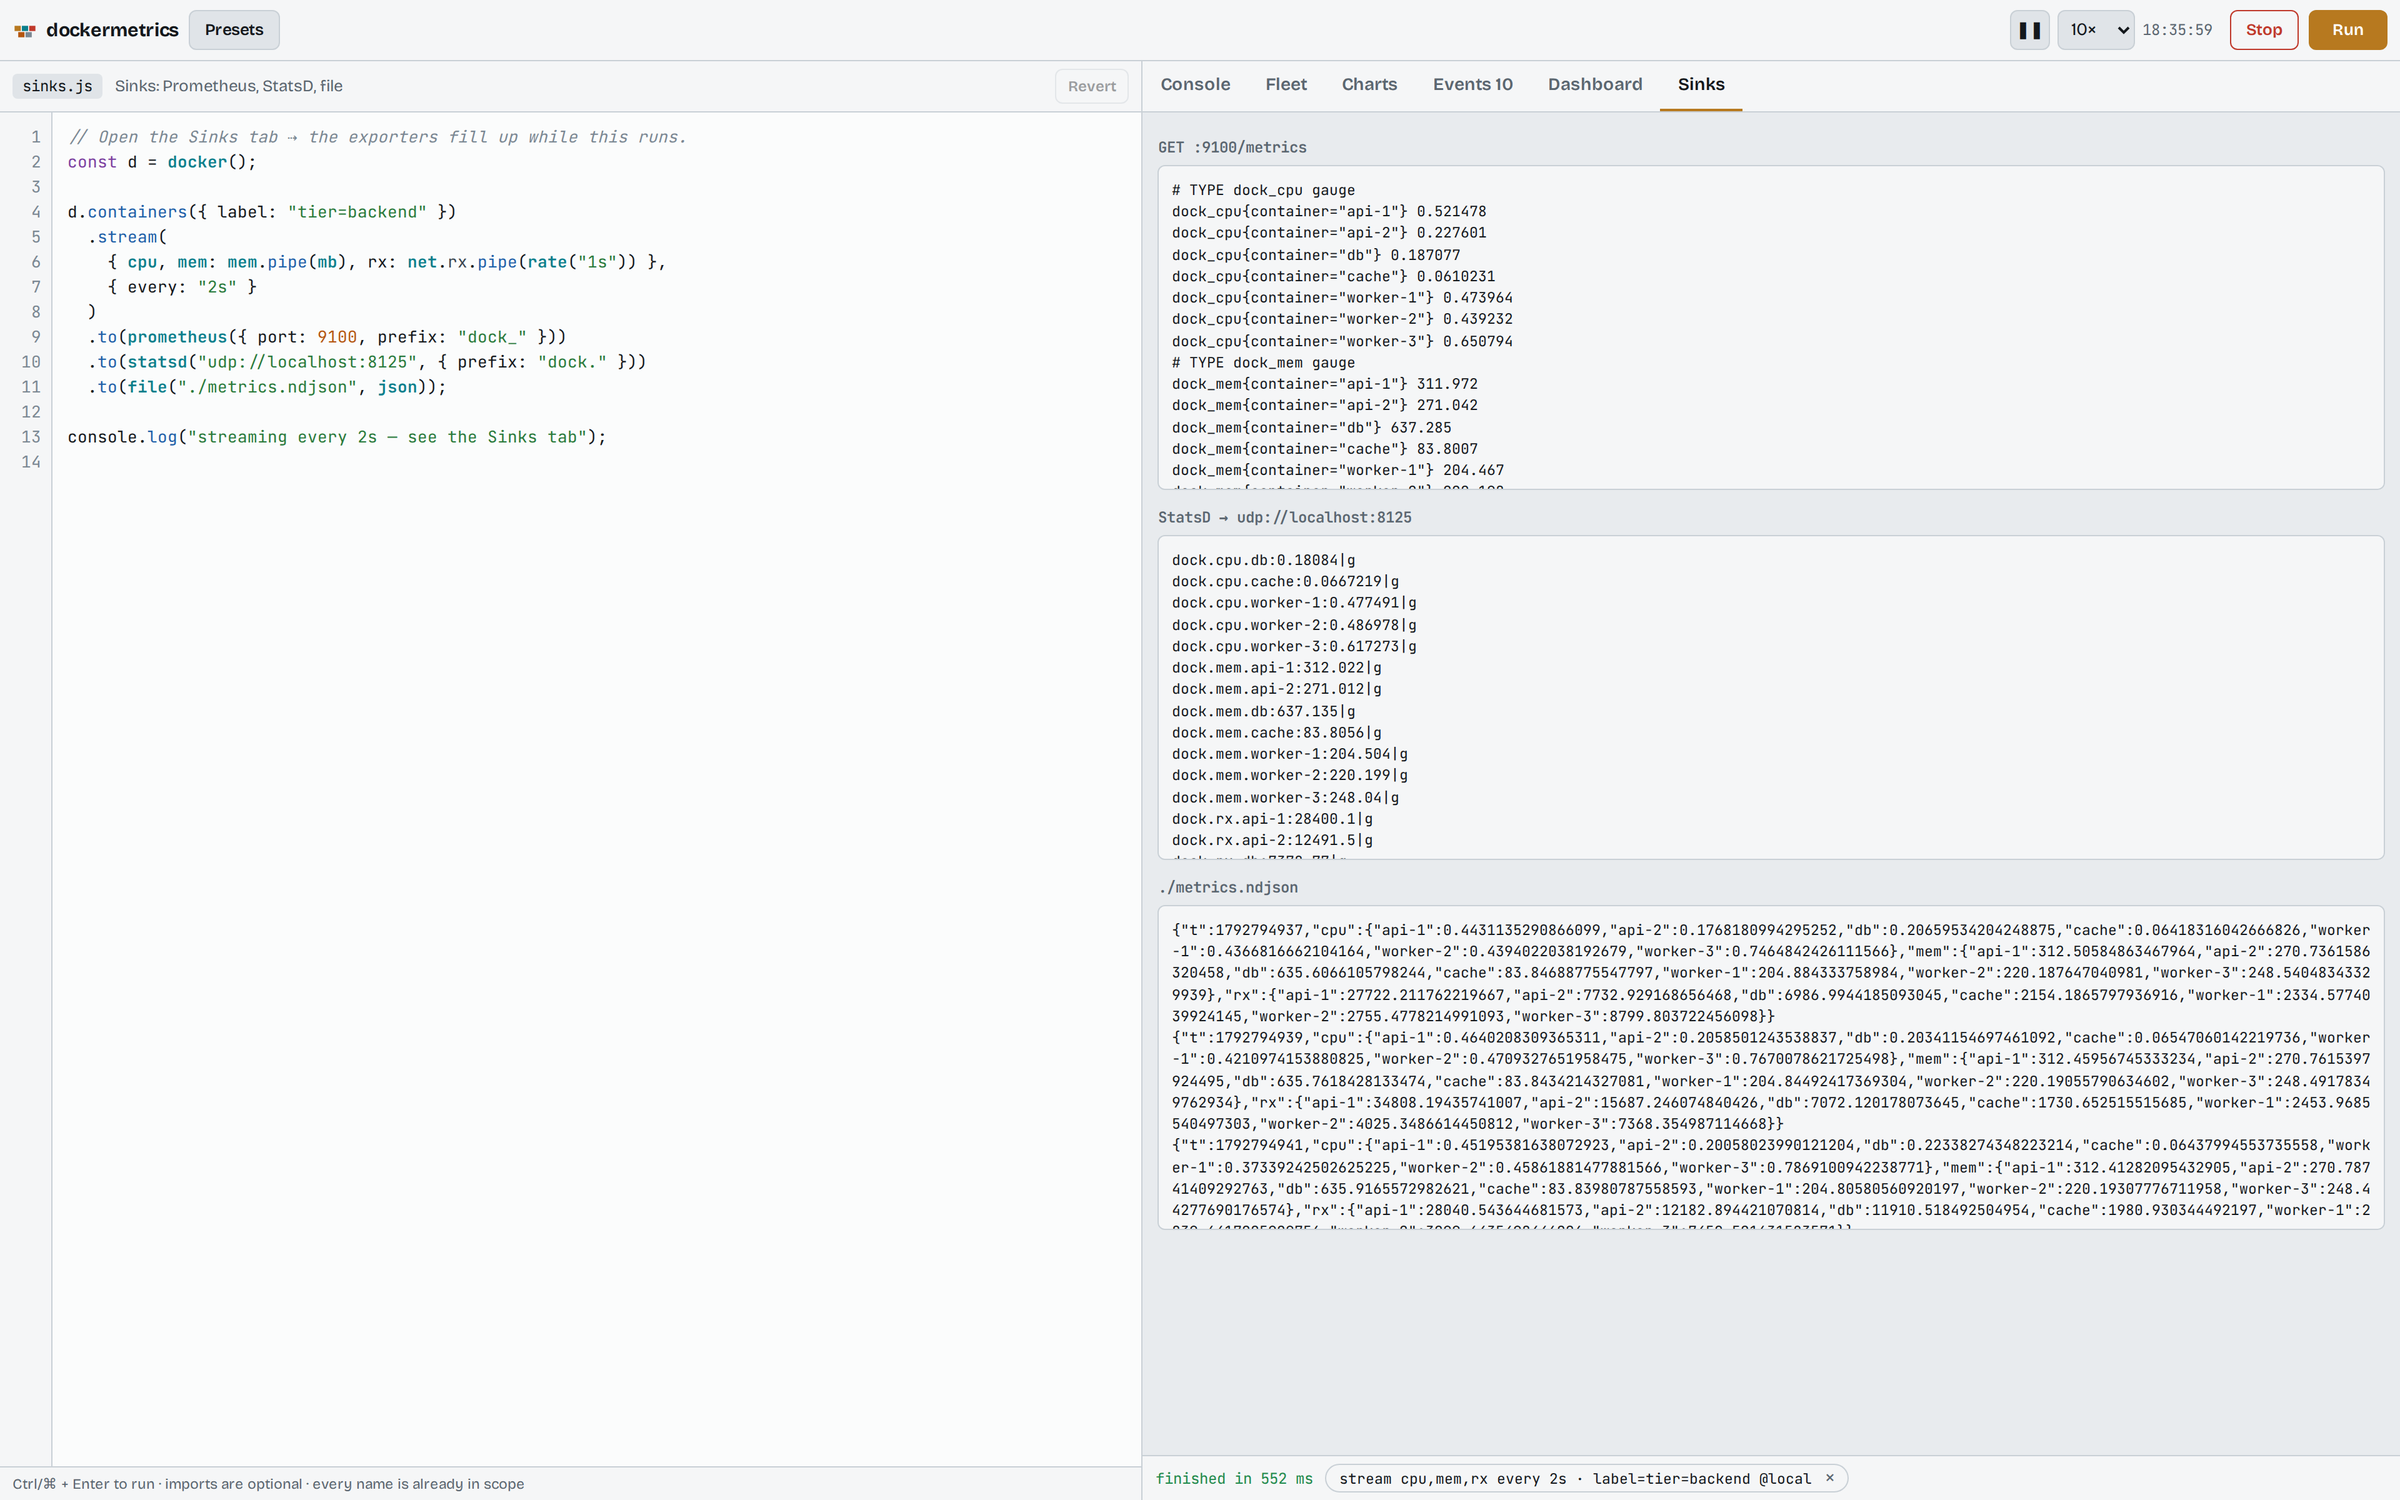
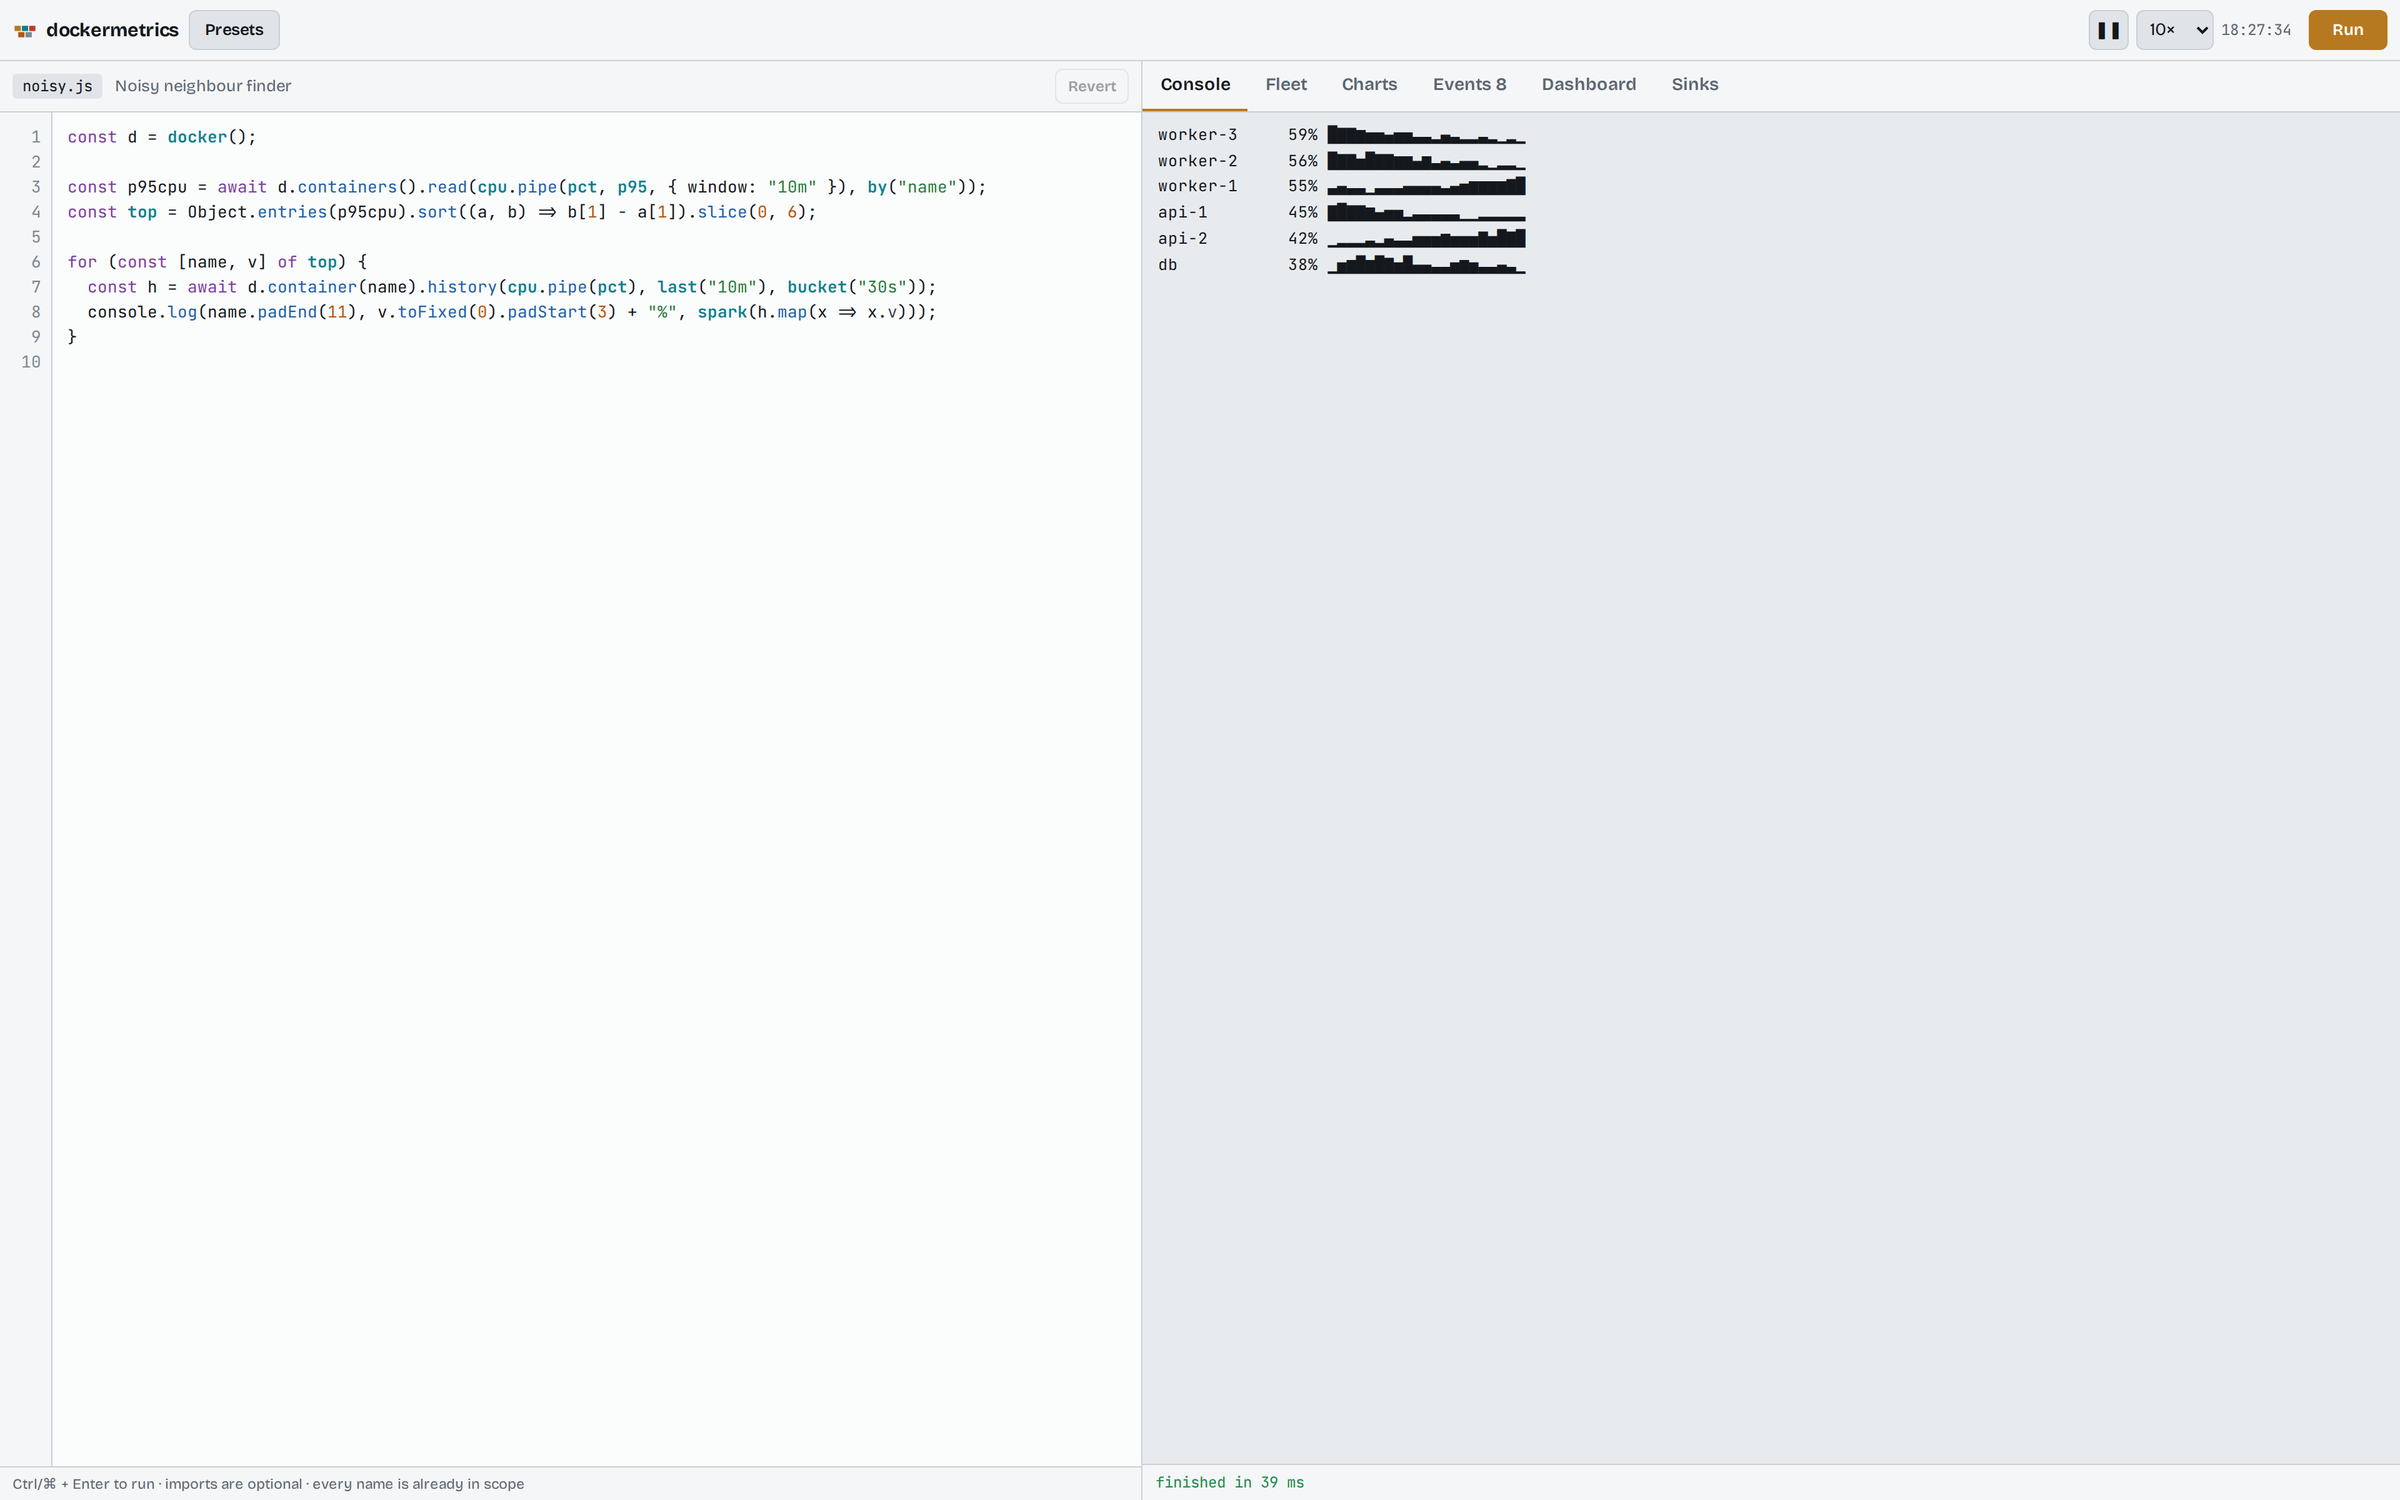
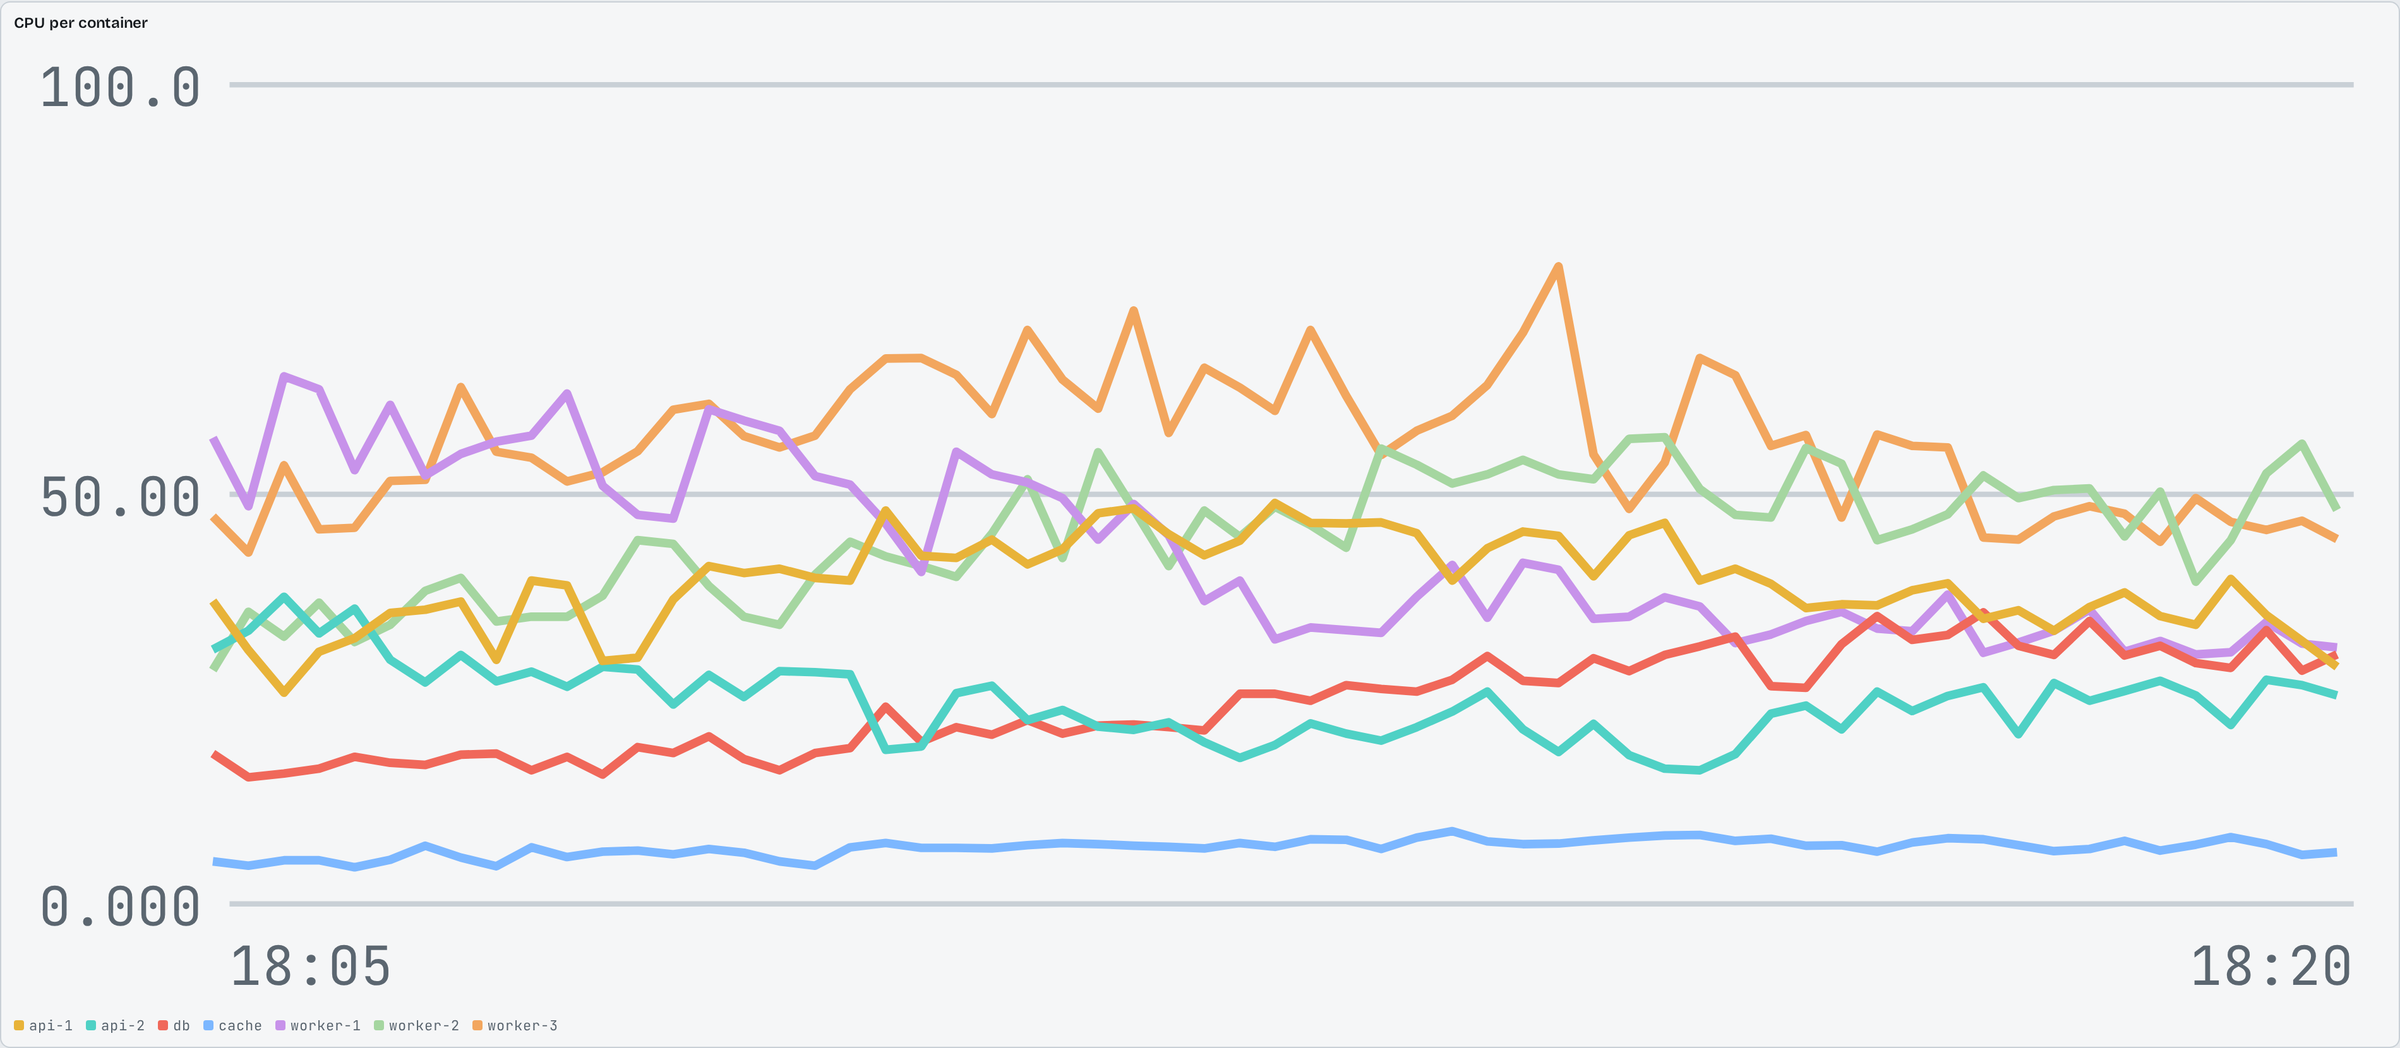
Subscribe →An IDE for a small JavaScript grammar over Docker metrics. You write a few lines (pick containers, pipe a metric, reduce it, stream it, alert on it, or build a dashboard), press Run, and watch it work against a simulated fleet that runs entirely in your browser: twenty containers on a local socket and three prod hosts, with CPU, memory, network, disk and process counts that drift and can be broken on purpose. Nothing connects to a real Docker daemon.
- Selectors and pipes: choose containers by name, glob, label, image or host, then pipe metrics through
mb,pct,of("limit")andrate(), and reduce them withavg,sum,max,p95and friends over a window. - Grouping and history: nest results with
by()by service, image or host, readlast(),since()andbucket()history, and compose metrics like values. - Streams and sinks: every read has a live twin for
for await; send streams to Prometheus, StatsD or a file and watch them fill in the Sinks tab. - Rules and chaos: predicates with
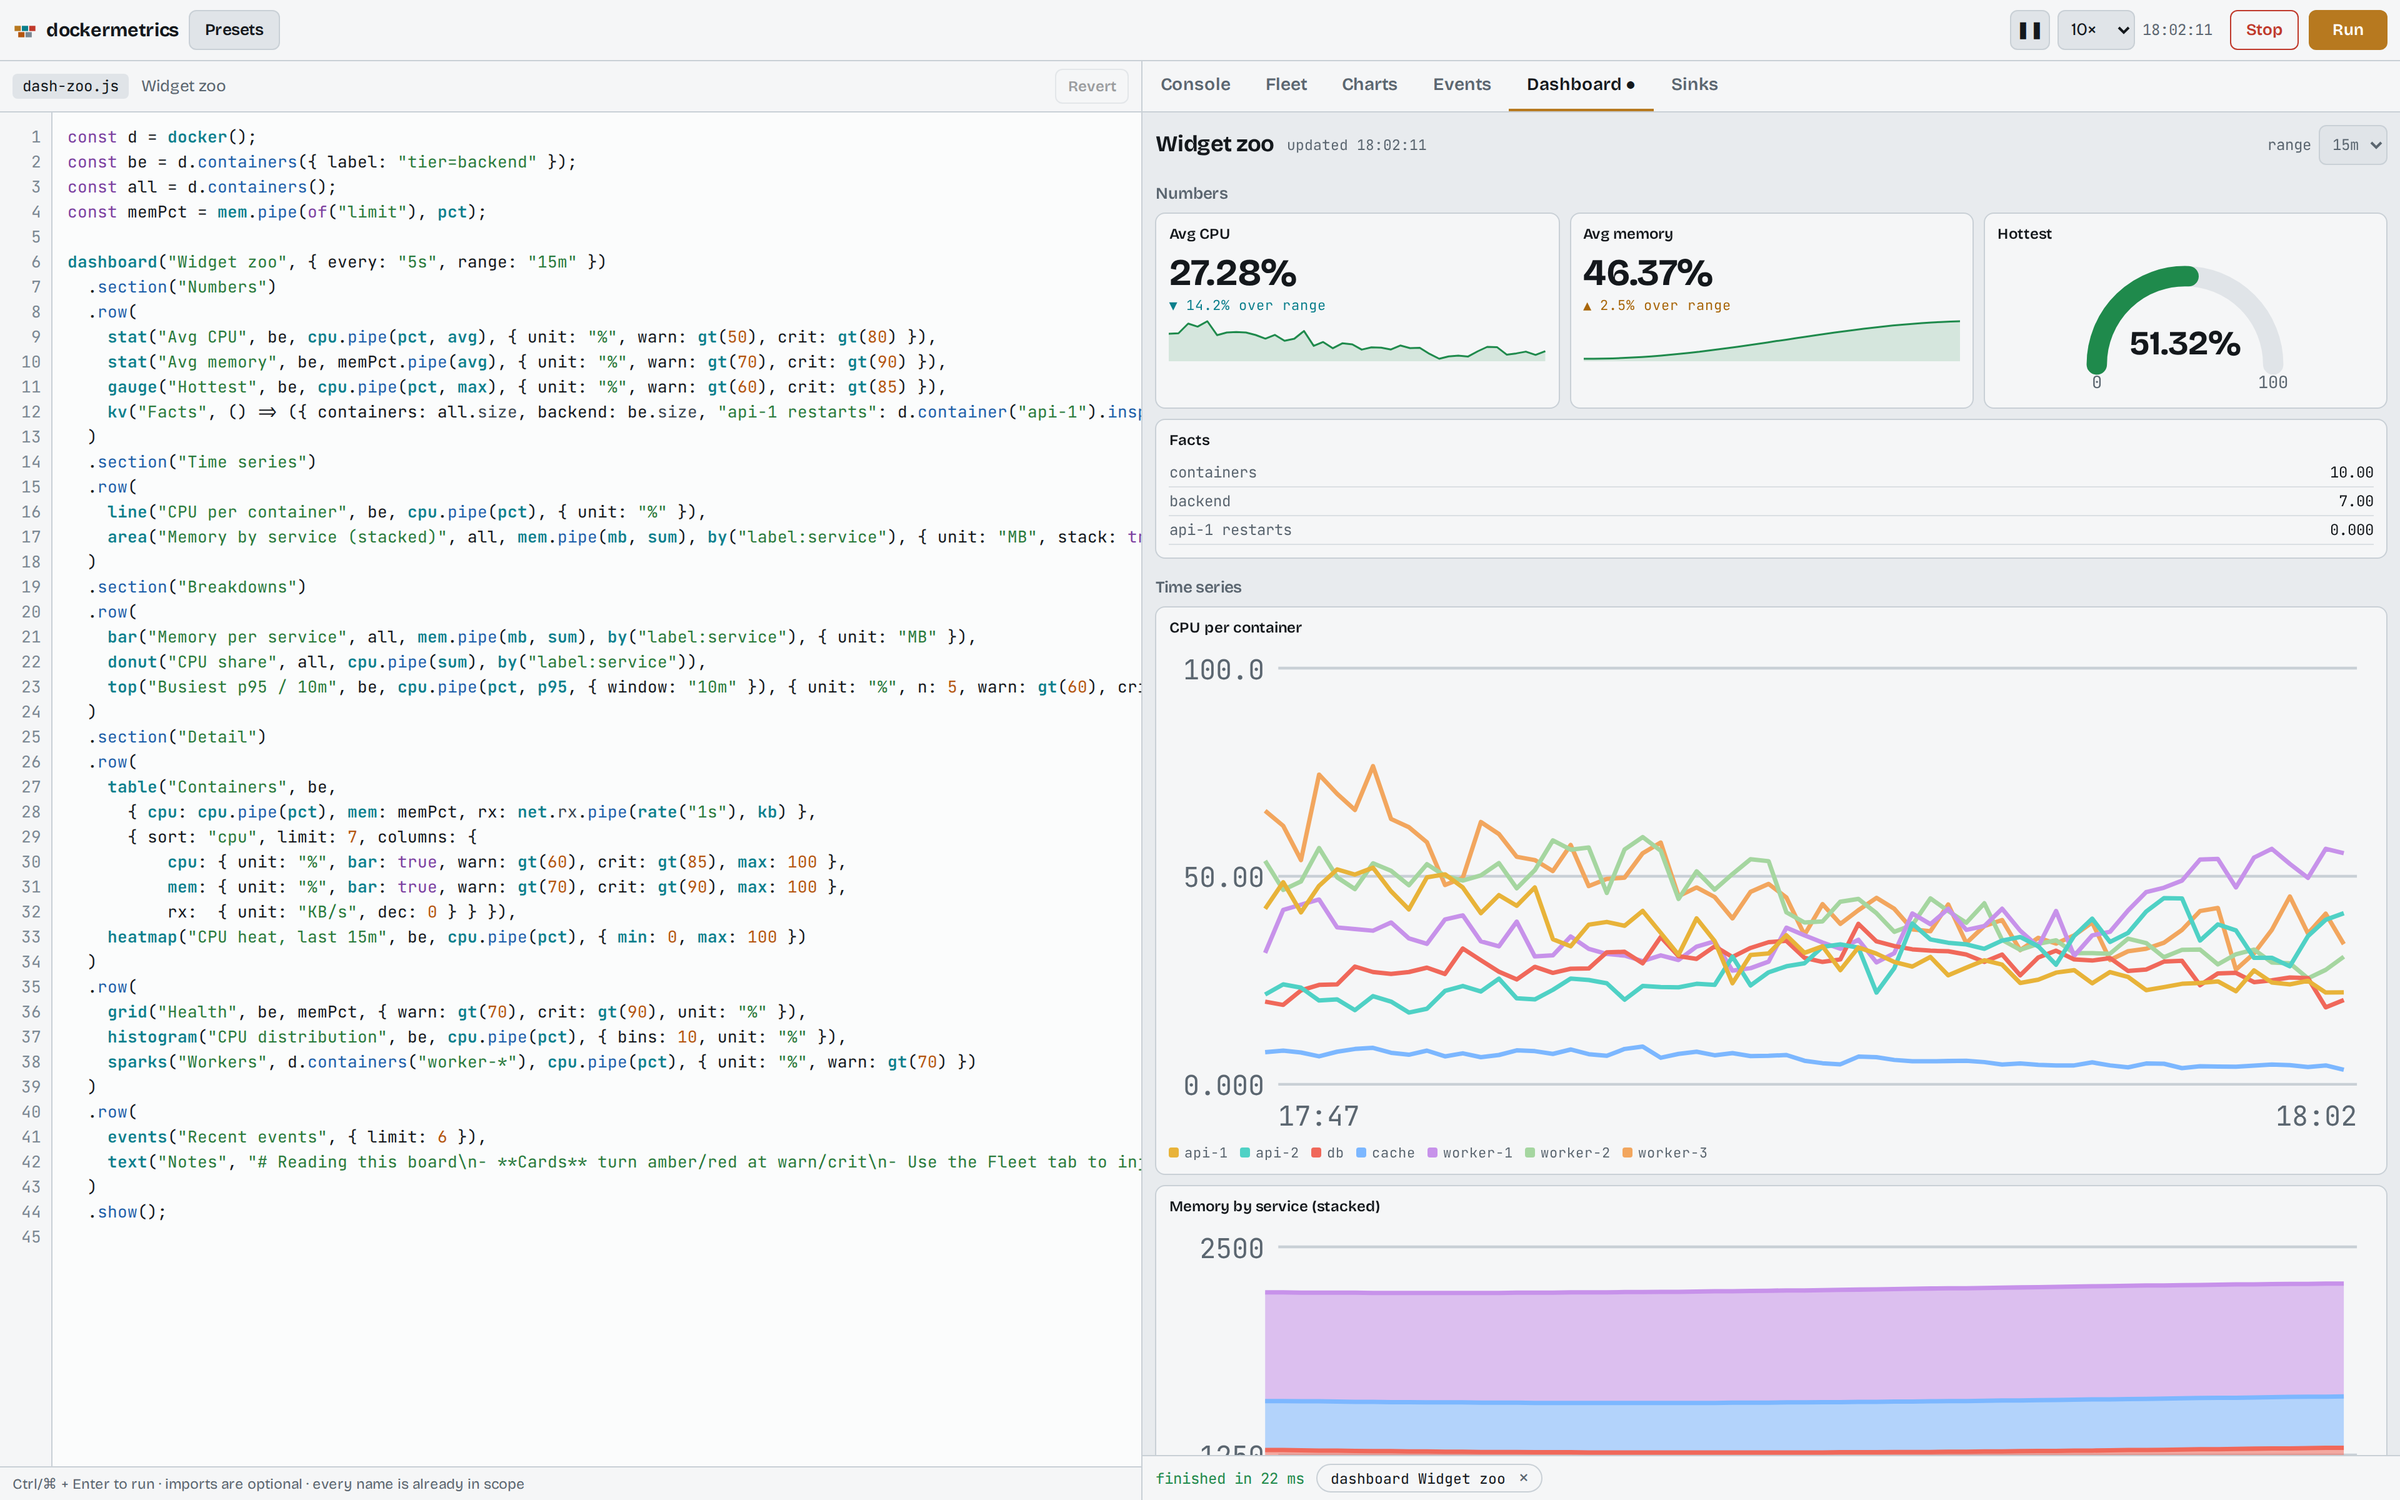
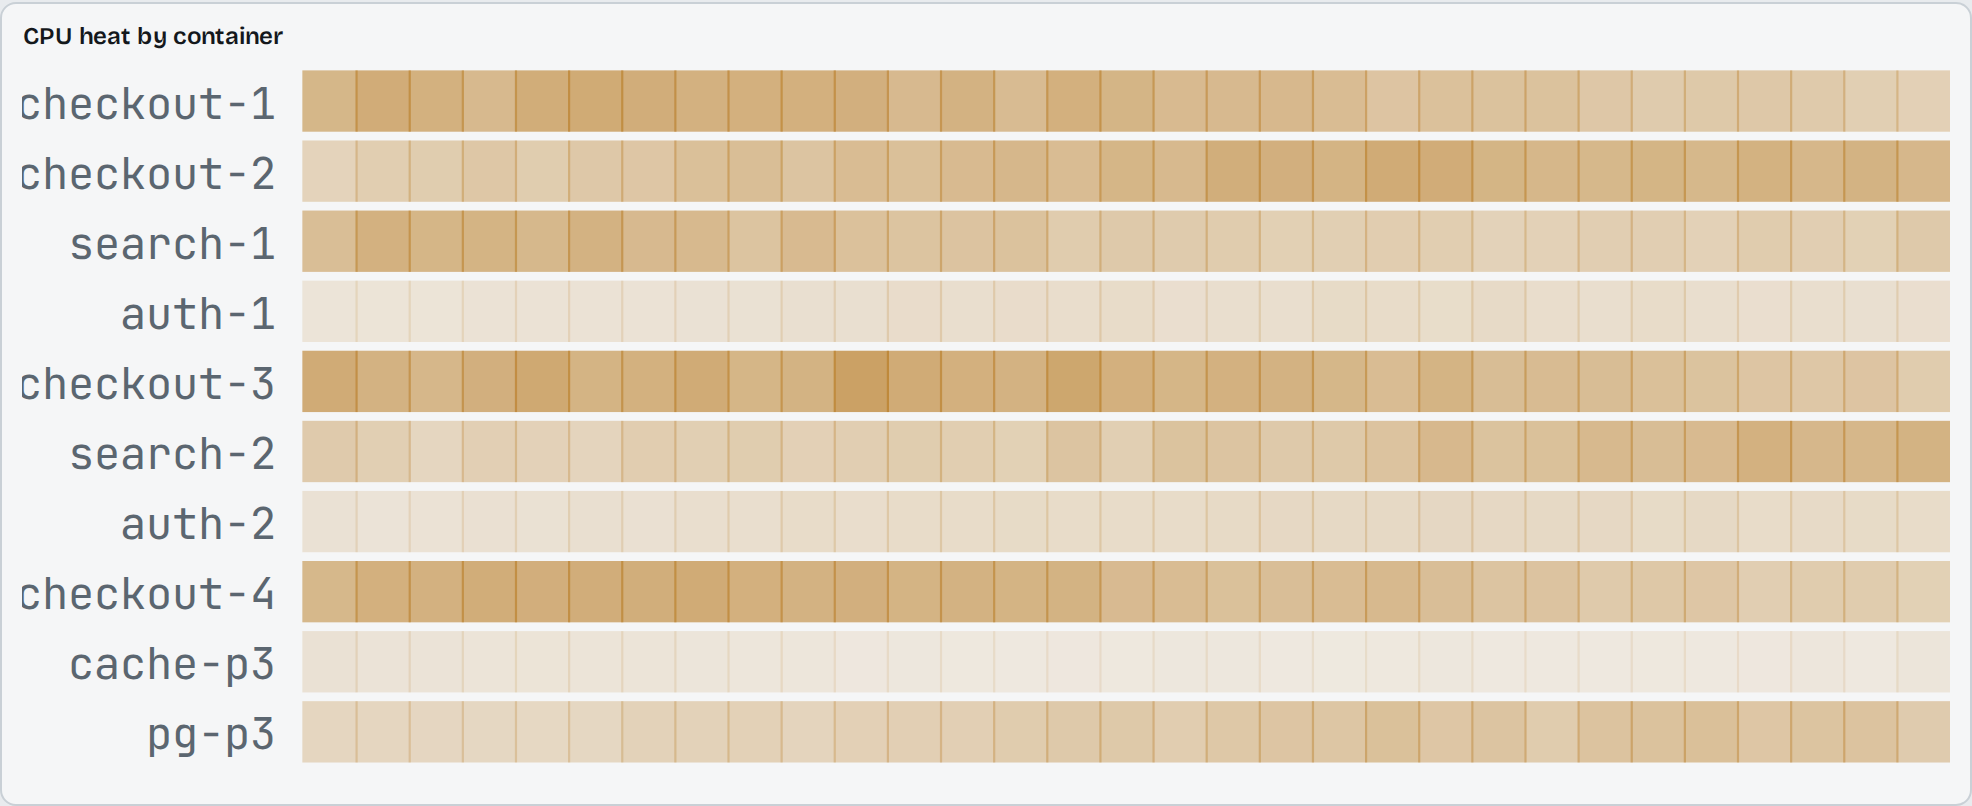
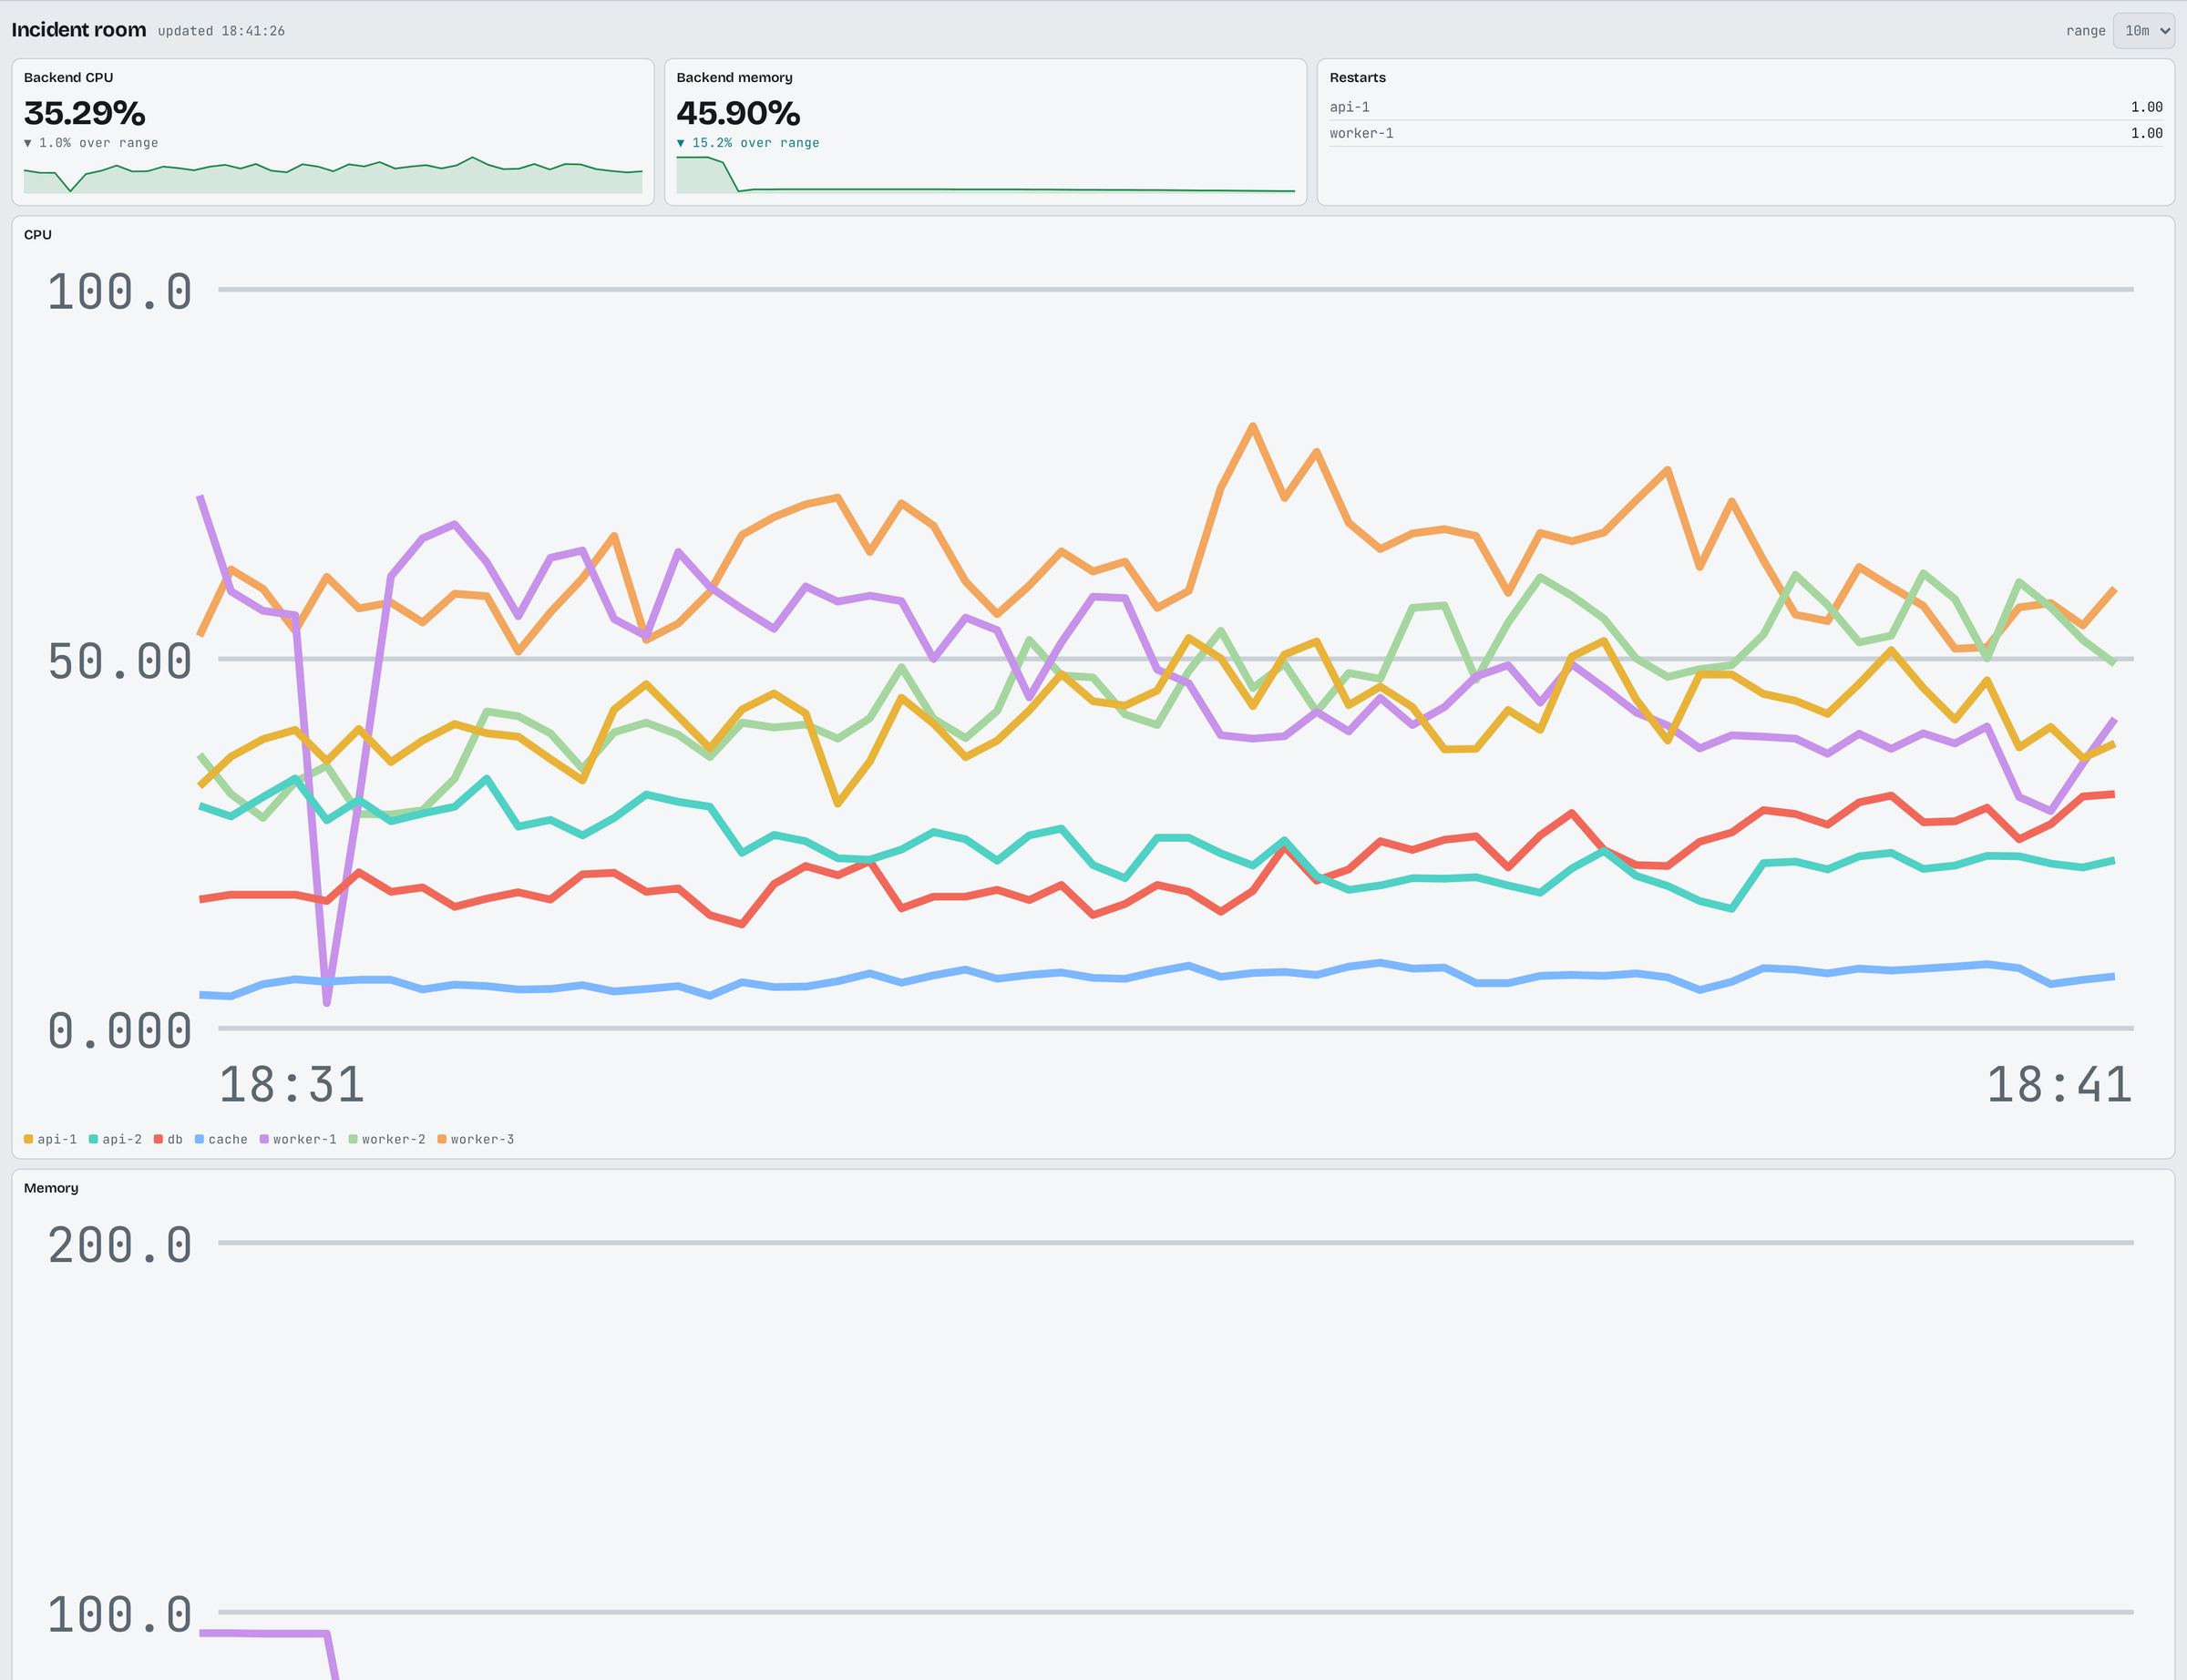
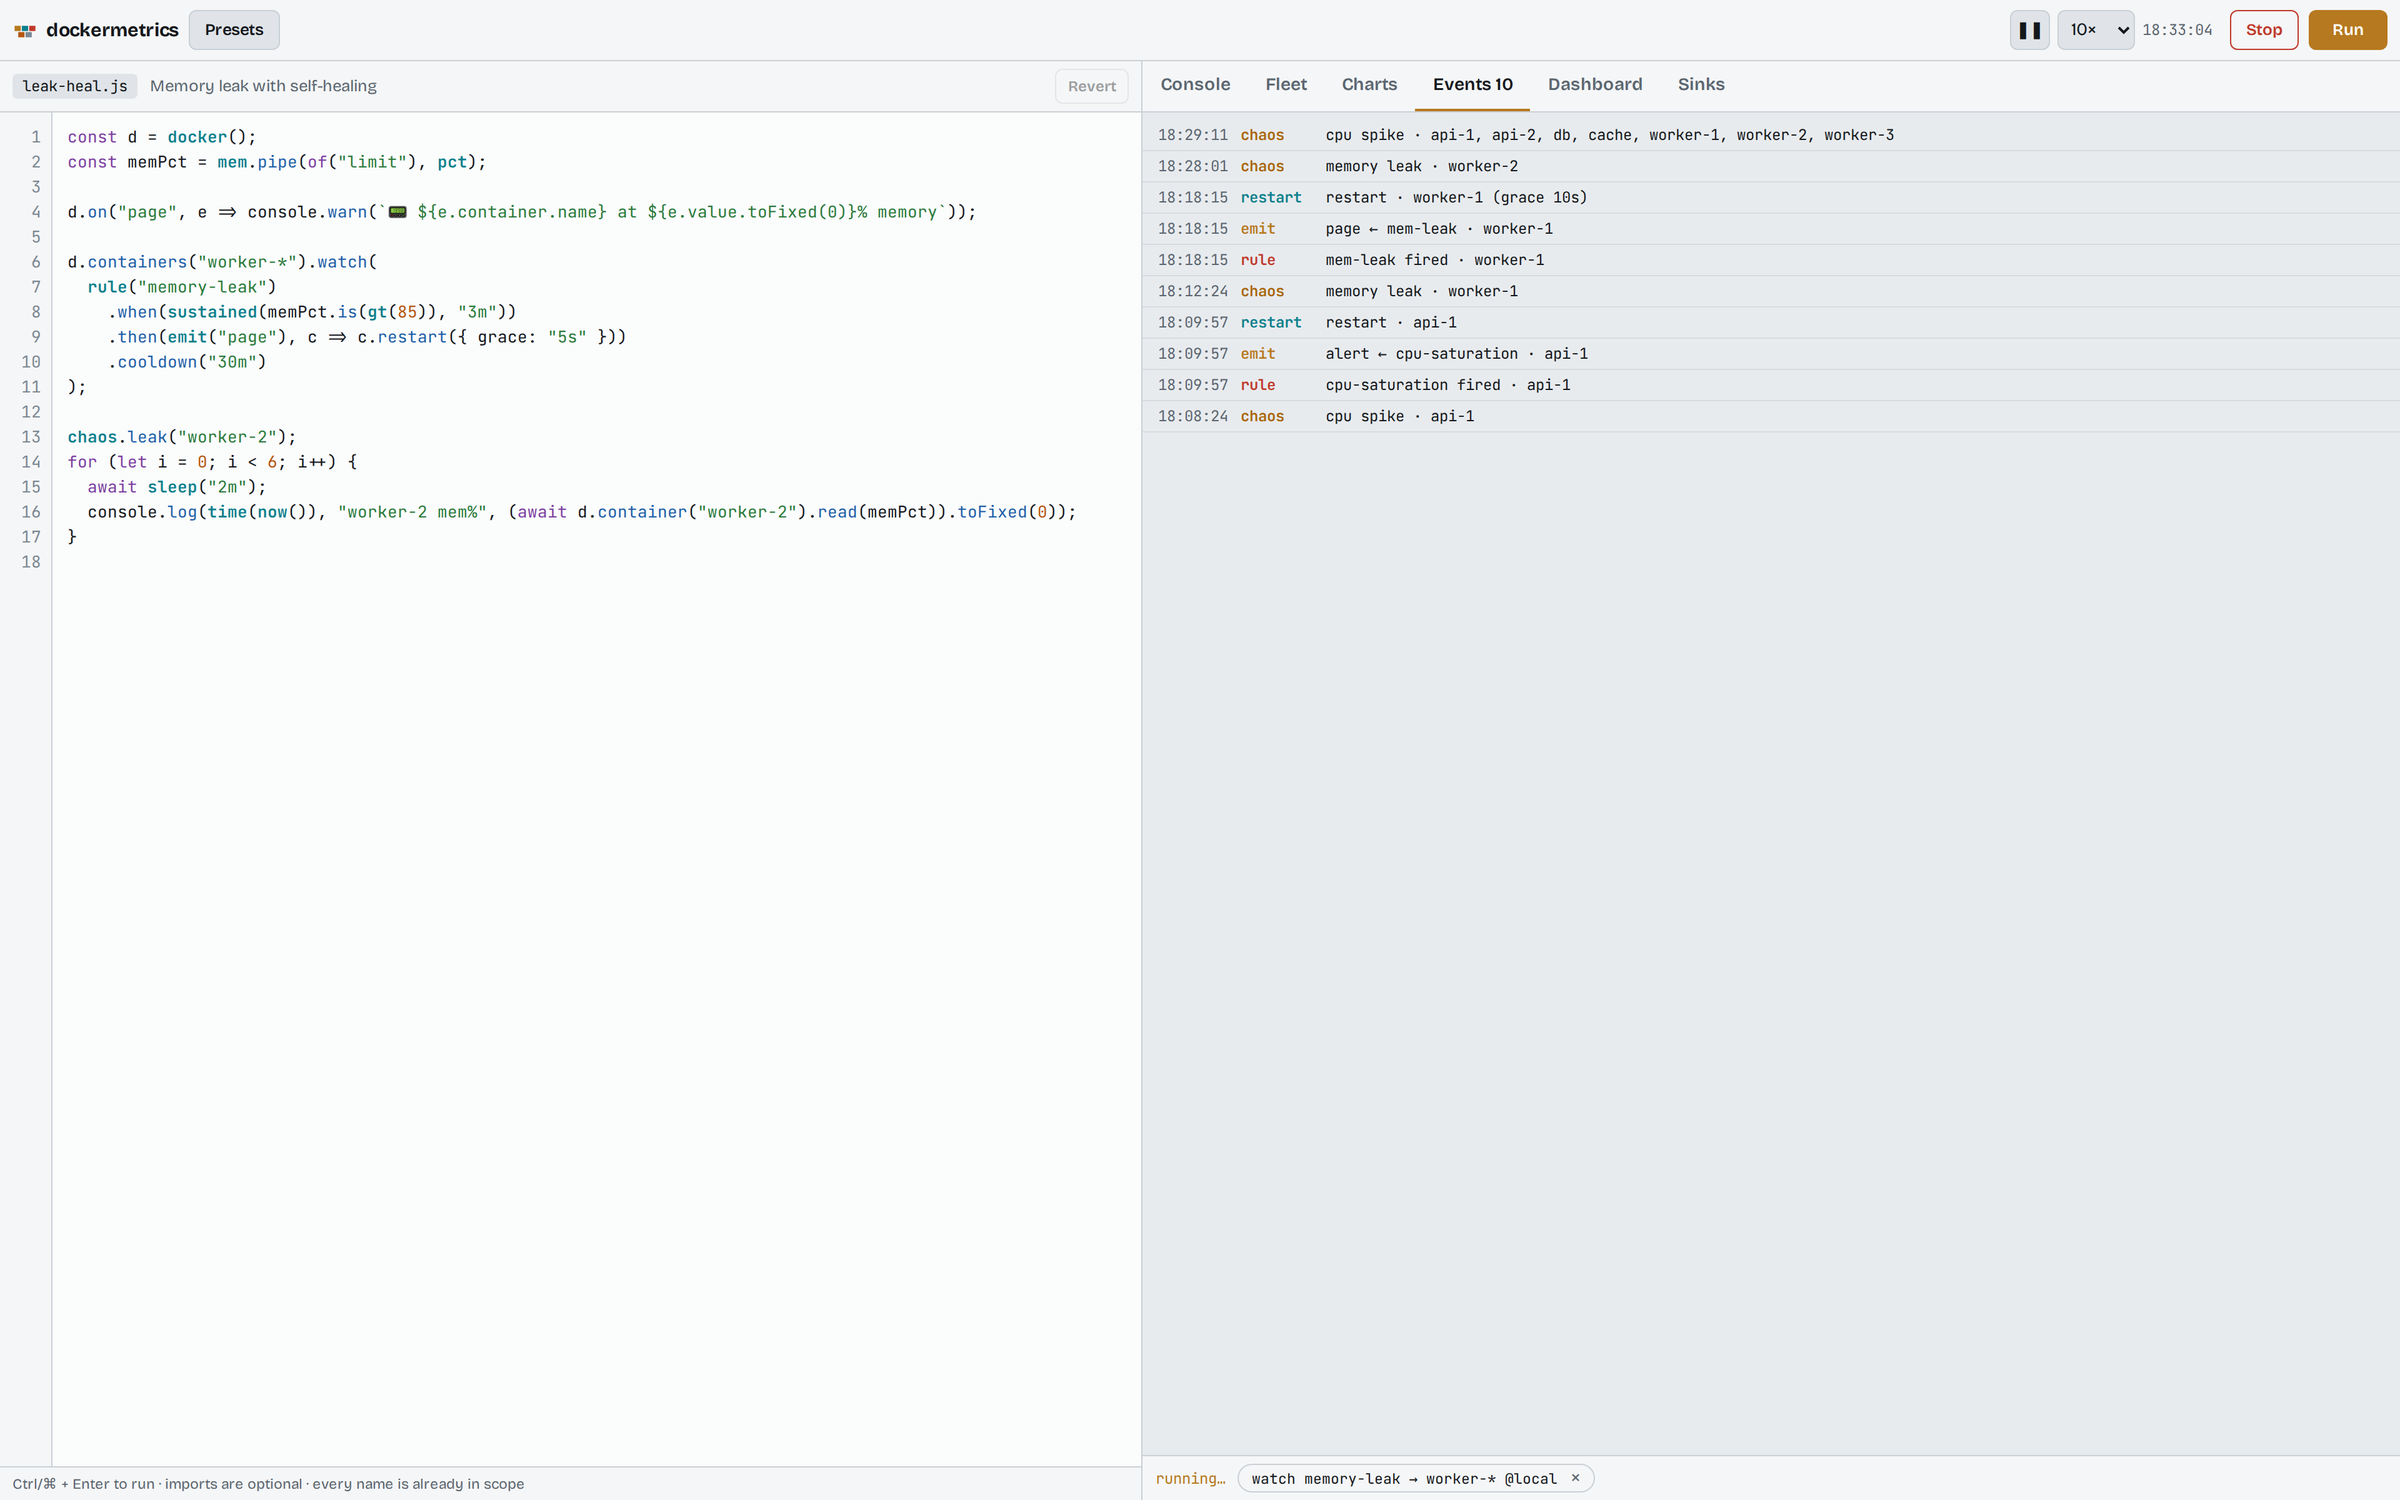
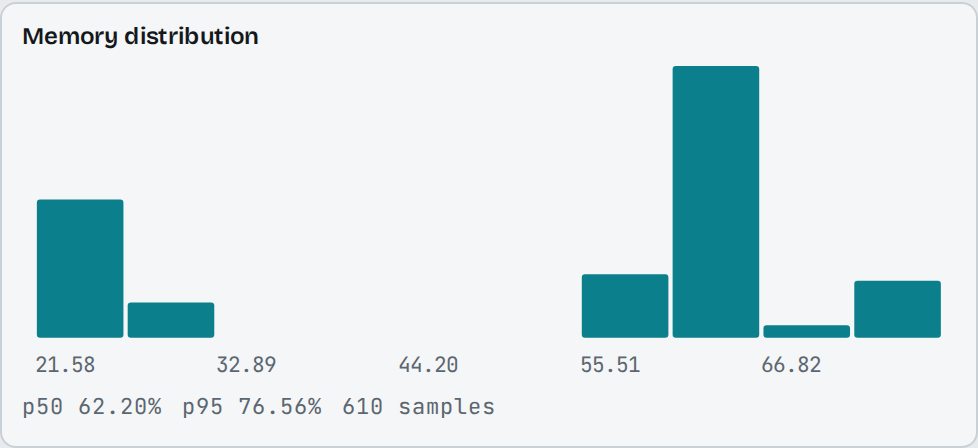
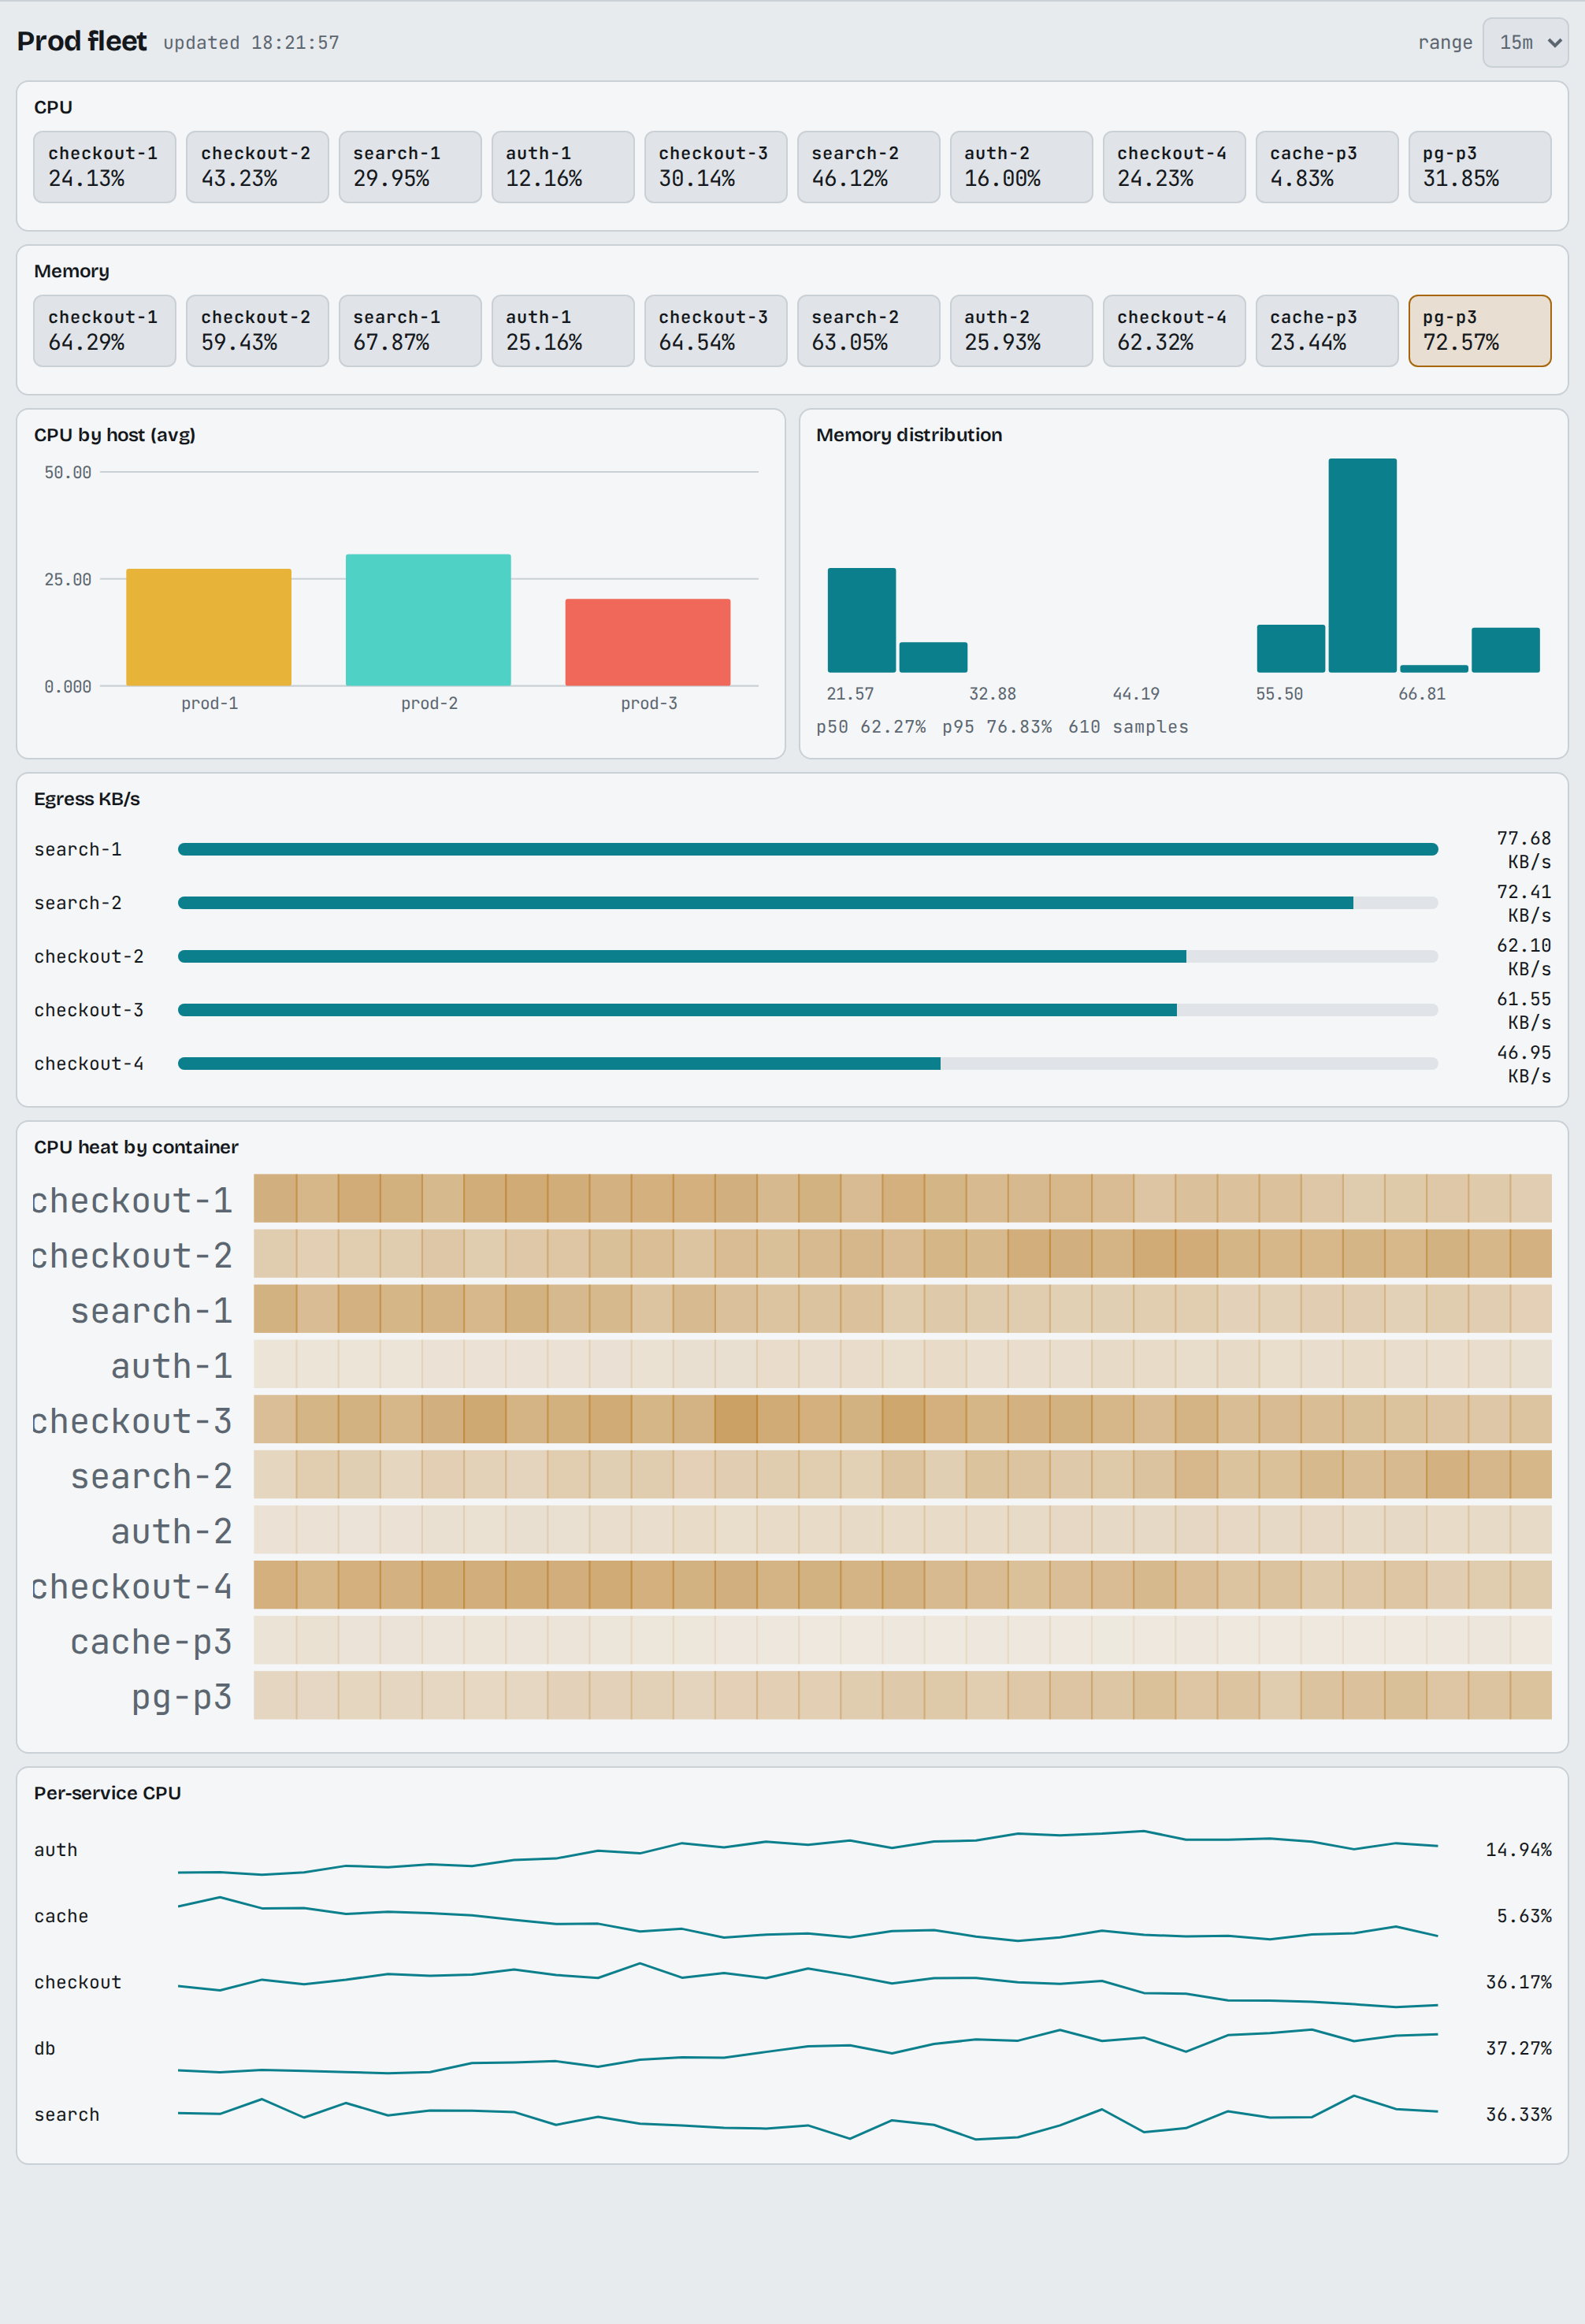
is(),and/or/notandsustained(), rules that page and restart with a grace period, and an event bus. Spike CPU, leak memory, stop, restart or heal containers from the Fleet tab. - Dashboards in a few lines: fifteen widget types (stat, gauge, line, area, bar, donut, table, heat map, grid, top, histogram, sparks, events, text, key/value), sections and rows, variables and ranges.
- A simulation clock you can pause or run from 1× to 120×, with Console, Fleet, Charts, Events, Dashboard and Sinks views.
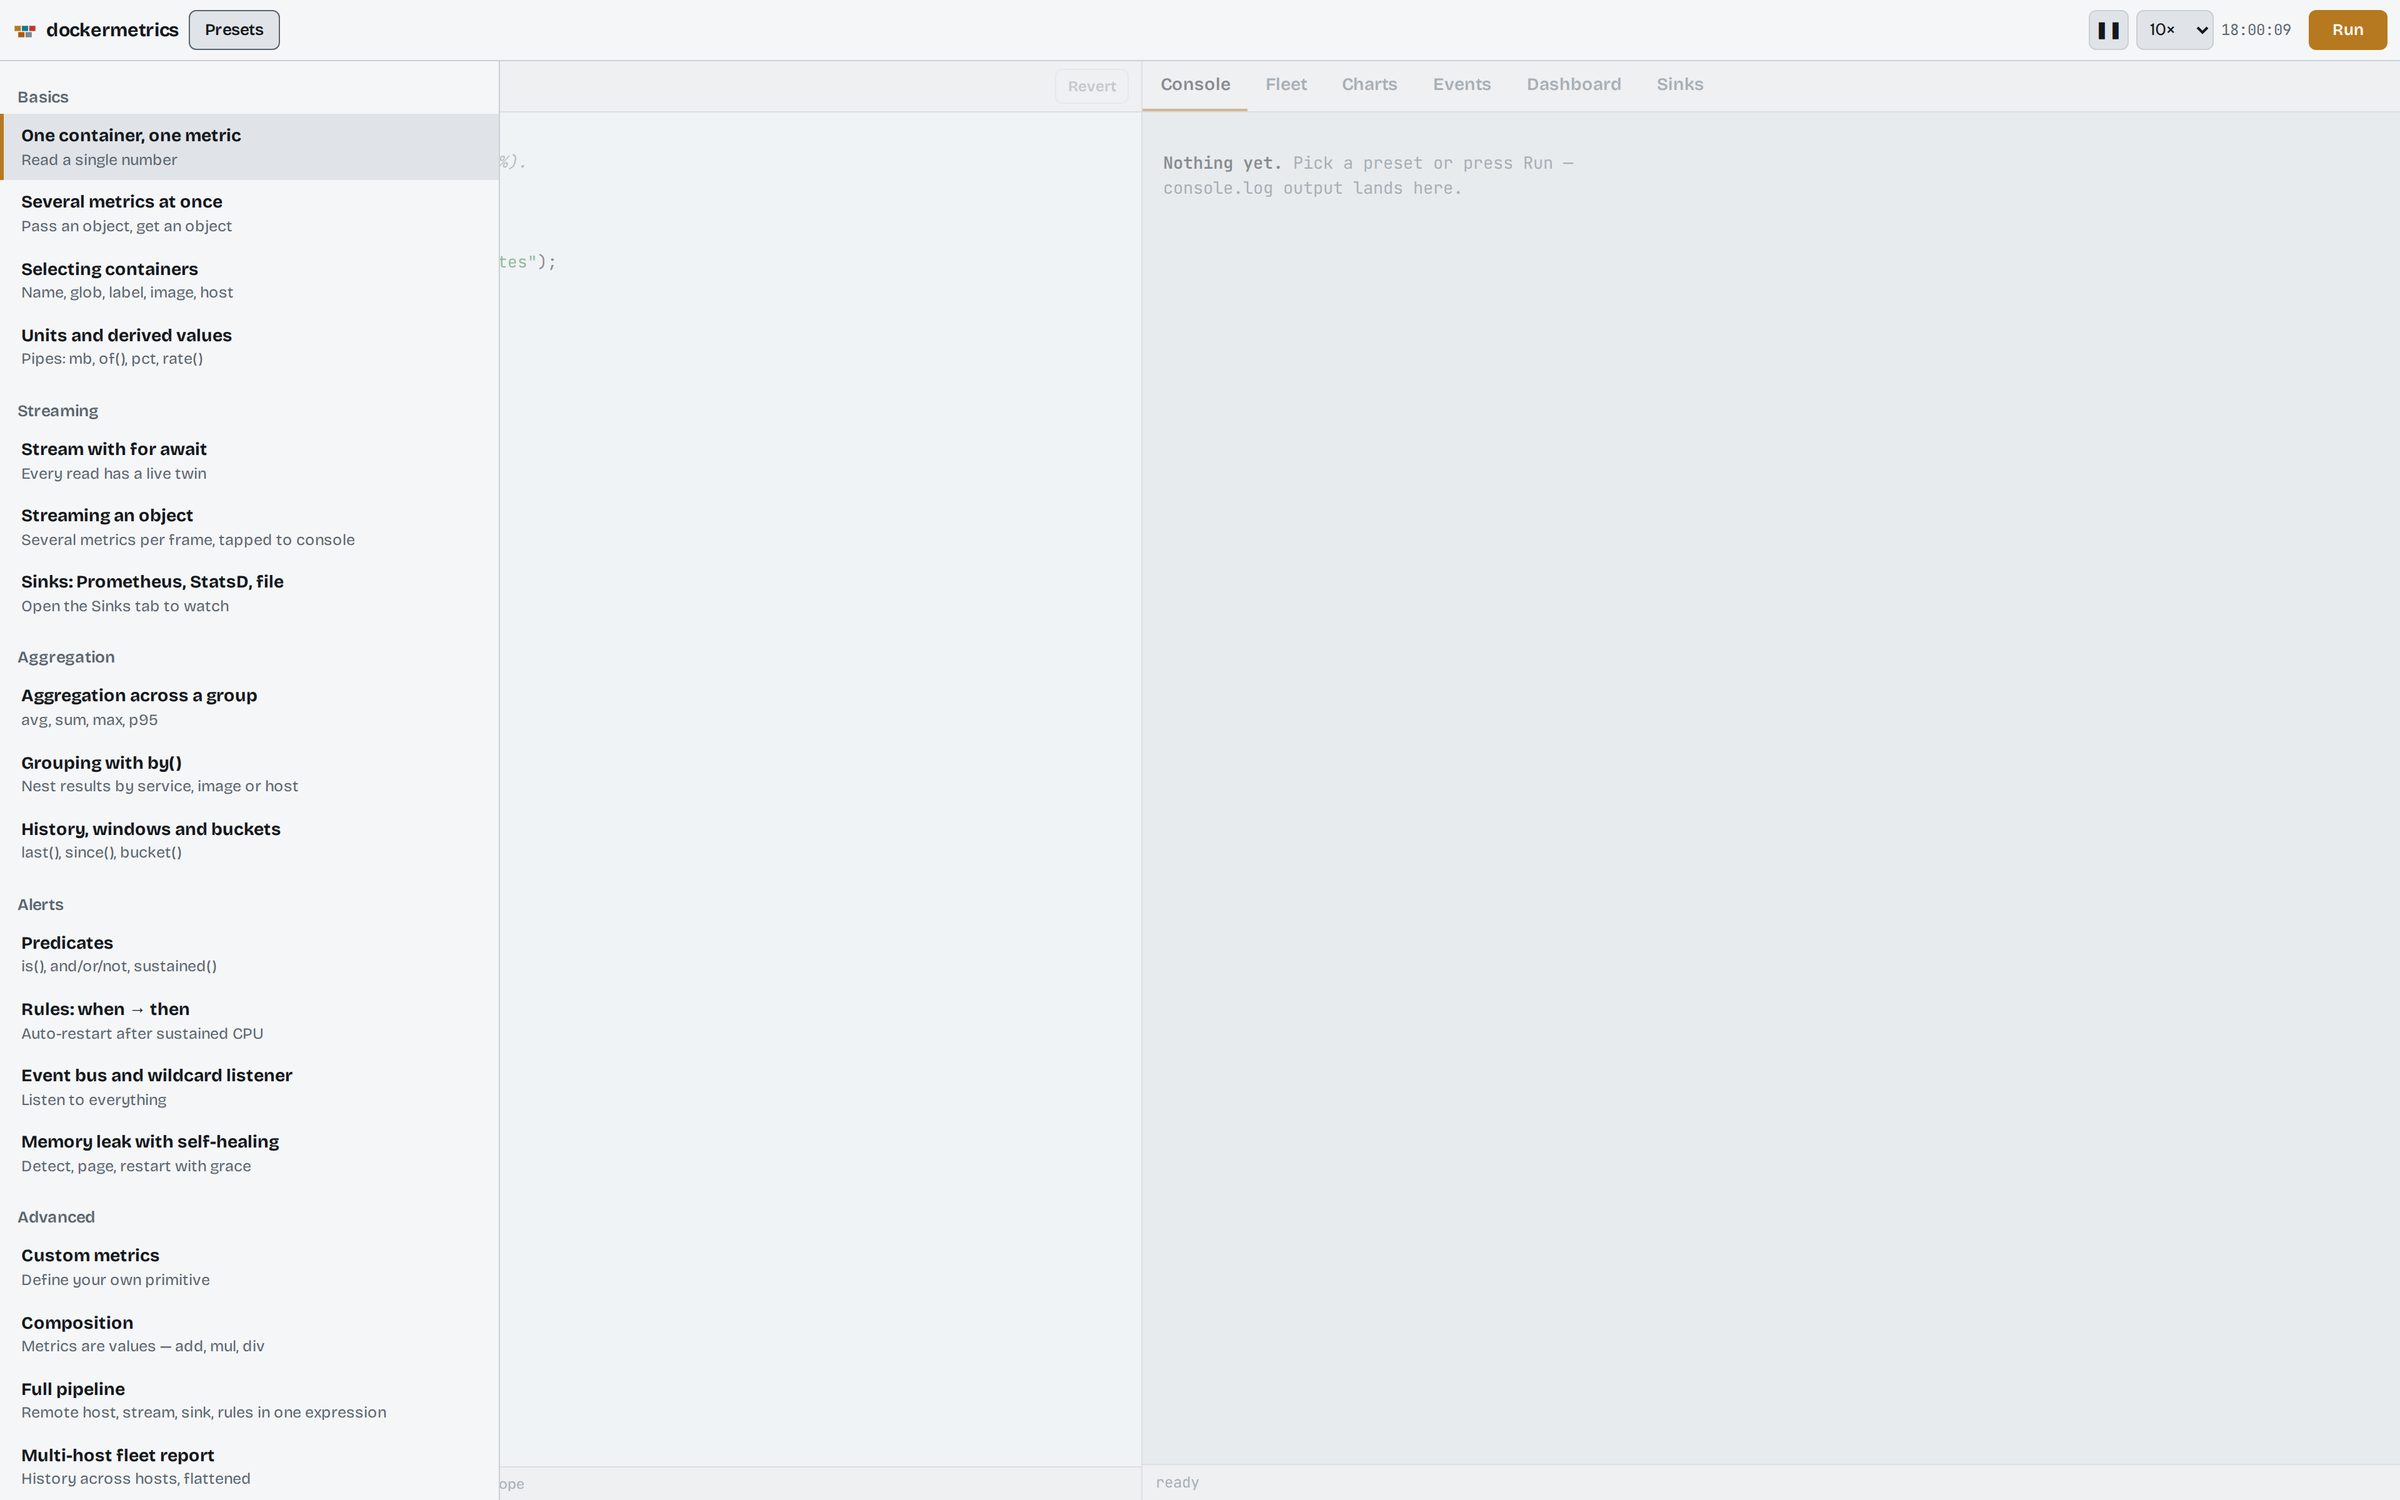
Twenty-nine presets come with it, from "One container, one metric" through the Widget zoo, an ops board with variables and a prod fleet wall to a live incident room, a noisy-neighbour finder, a capacity planner and an incident drill.